
We Connect Asia

PROJECT FINANCE

The Real Cost of Green Hydrogen in 2026:
A Benchmark Guide

6 min read  ·  Jan 28, 2026  ·  By Alex

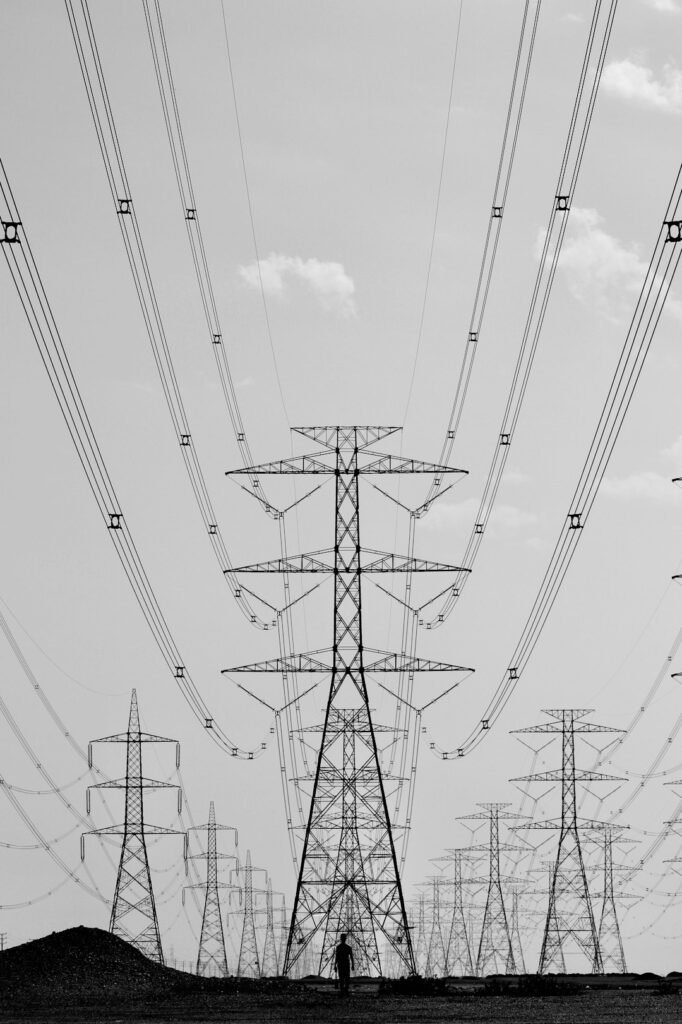
Electrical power transmission poles against the sky

Every green hydrogen cost conversation I have hits the same wall. Investors quote “$3/kg” or “$5/kg” as if one number applied everywhere. It doesn’t. The cost is overwhelmingly a function of your local power price. Most projects still need policy support or a very cheap power supply, because the grey-green gap stays wide.

In short: green hydrogen cost in illustrative 2026 projects runs USD 3-7/kg, against grey hydrogen at USD 1.50-3/kg. Electricity drives the cost: USD 1.04/kg at $20/MWh power. At $60/MWh power, that same electricity climbs to USD 3.12/kg. Your local power price therefore tells you more about viability than any other single variable.

Facebook
Twitter
LinkedIn

In this article

The electricity cost table every developer should memorize

At roughly 52 kWh of electricity needed per kg of hydrogen produced, the relationship between power price and hydrogen cost is close to linear:

Power price Electricity cost per kg H2
$20/MWh $1.04
$30/MWh $1.56
$40/MWh $2.08
$50/MWh $2.60
$60/MWh $3.12

These figures exclude capex, financing, and O&M, so they’re a floor, not a full cost estimate. But the floor itself tells you something important: cutting power price from $40 to $20/MWh would save a 10,000-tonne-per-year plant about USD 10.4 million annually on electricity alone. If you’re evaluating a site, the power purchase price you can secure is doing more work in your cost model than almost any equipment decision.

The electrolyzer cost gap: China versus everywhere else

There’s a second major cost variable that gets less attention than power price: where your electrolyzer is made. The IEA estimates Chinese alkaline electrolyzers cost roughly USD 500-1,100/kW, while equivalent equipment sourced outside China runs USD 1,900-2,500/kW, more than double in some cases. China holds nearly 70% of global electrolyzer manufacturing capacity, which is a meaningful procurement consideration for any Southeast Asian project comparing equipment sources.

Where parity actually sits, and when it might arrive

The IEA’s cost-acceptability finding is blunt: without policy support, acceptable green hydrogen costs sit below USD 2/kg. That is well under the current $3-7/kg range. A carbon price of USD 200/tonne could offset a $2/kg premium when each kg of hydrogen saves 10 kg CO2e. Most markets, however, have no carbon pricing anywhere near that level.

Period Expected competitiveness
2026-2028 Grey hydrogen remains cheaper in most markets
2029-2030 Selected Chinese projects could approach parity, mainly local-use cases
2030-2035 More regional opportunities, depending on cost declines and policy
Beyond 2035 Wider parity remains uncertain

Separately, one industry cost model projects globally traded green hydrogen at around USD 5.30/kg by 2030. The caution is worth taking seriously: a slight rise in the cost of capital could add roughly USD 1.4/kg. In a region where financing costs and country risk premiums vary, that sensitivity matters as much as the headline cost.

Where this breaks in practice

  • Quoting a single global cost figure without specifying your own power price. Given the near-linear relationship between power cost and hydrogen cost, a developer’s own secured or modeled power price is a far more useful starting point than any published benchmark.
  • Ignoring the cost-of-capital sensitivity. A roughly $1.4/kg swing from a “slight increase” in financing cost is large relative to the entire cost gap to parity. A project’s financing structure deserves the same scrutiny as its technical design.
  • Comparing your project’s cost to grey hydrogen without accounting for shipping or transport. The IEA notes that shipping adds at least $2/kg for pure hydrogen, which matters significantly for any project planning to export rather than sell locally.

A practical method for benchmarking your own project's cost

  1. Start from your actual or realistically modeled power price, using the per-kg electricity cost table above as your baseline, before layering in capex and financing.
  2. Compare electrolyzer sourcing options explicitly, factoring in the meaningful cost gap between Chinese and non-Chinese equipment.
  3. Stress-test your model against a cost-of-capital increase, given how sensitive the levelized cost is to financing terms.
  4. Decide early whether your offtake is local or requires shipping, since that changes your effective delivered cost by at least $2/kg.

Common mistakes I see developers and investors make

  • Using a published global average cost figure instead of modeling from the project’s actual local power price.
  • Underestimating how much electrolyzer sourcing choice affects total project cost.
  • Not stress-testing the cost model against financing cost volatility.
  • Comparing production cost to grey hydrogen without adding shipping or transport costs for export-oriented projects.

A quick checklist before you take this to lenders

  • A cost model built from your actual or realistically secured power price, not a published average
  • An explicit electrolyzer sourcing comparison, including the China cost advantage
  • A financing cost sensitivity analysis showing the impact of a cost-of-capital increase
  • A clear statement of whether your offtake is local or export, with shipping costs included if applicable

Sources

FAQ

Electricity is the dominant input cost for electrolysis, and power prices vary enormously by market. At 52 kWh per kg of hydrogen, moving from $20/MWh to $60/MWh power triples the electricity cost component alone, from roughly $1.04/kg to $3.12/kg, before any other cost is considered.

Industry projections suggest grey hydrogen will remain cheaper in most markets through 2028, with selected Chinese projects potentially approaching parity by 2029-2030, mainly for local use cases. Wider regional and global parity remains uncertain beyond 2035, and will depend heavily on continued cost declines and policy support.

Yes, significantly. The IEA estimates Chinese alkaline electrolyzers at roughly $500-1,100/kW versus $1,900-2,500/kW for equivalent equipment sourced elsewhere, more than double in some cases, which materially affects total project capex.

If you’re trying to build a realistic green hydrogen cost model for your own project, or want a second set of eyes on your power price and financing assumptions, that’s exactly the kind of question I help developers and investors work through. Get in touch and we can look at your numbers together.

I’m part of the WeConnect Asia team, working with developers and investors on low-carbon infrastructure projects across Southeast Asia.

This article is for general informational purposes and does not constitute financial, legal, or engineering advice. Figures cited are drawn from publicly reported data and should be independently verified before use in any financial model.

Not sure your project would survive a credit conversation?

A short call is usually enough to see where your project stands against what a lender or an equity investor will ask for. Tell me where your project is today, and I will tell you what the next conversation needs to look like.

Alex, Founder of WeConnect Asia

Alex, Founder of WeConnect Asia

I help low-carbon fuel and carbon removal project developers in Southeast Asia secure the commercial and financial partners needed to reach FID.

More about me·Get in touch

Facebook
Twitter
LinkedIn

Related articles