
Home » SAF Production Cost Breakdown: Feedstock, Capital and Conversion
SAF Production Cost Breakdown: Feedstock, Capital and Conversion
10 min read · Dec 2, 2025 · By Alex
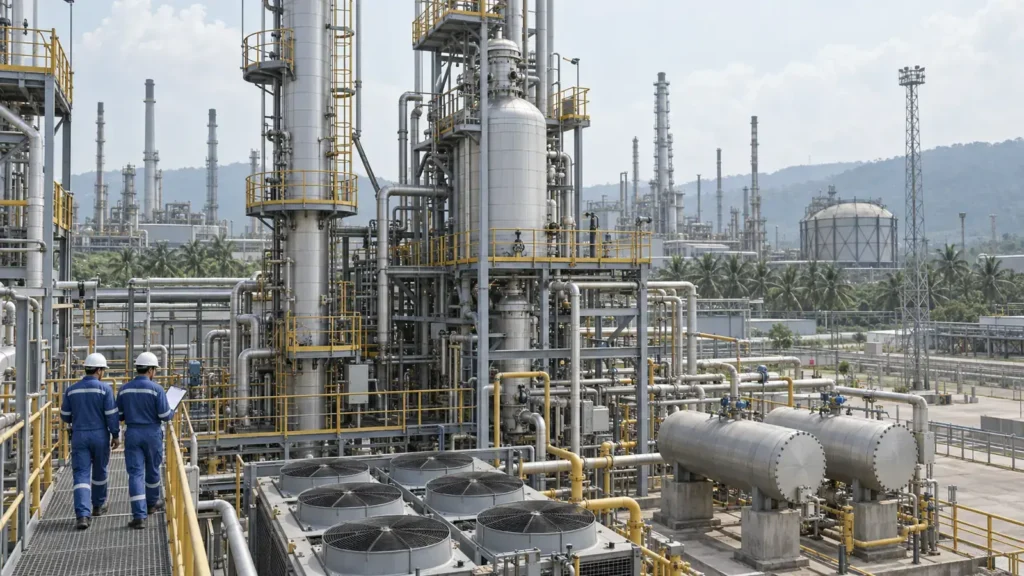
When I open a feasibility file, my first question is which cost line dominates the outcome. The production cost of a fuel of this kind stacks into feedstock (the raw material), capital invested in the process, conversion, operating expenditure (the running cost of the plant), financing and logistics, and the dominant line changes with the pathway. Sustainable aviation fuel projects do not share one cost structure. The SAF production cost therefore reads pathway by pathway: the European Union Aviation Safety Agency estimated the average production cost in 2024 at 1 461 euros per tonne for biofuels and 7 695 euros per tonne for e-fuels, which the ICCT converts into a premium of 2.1 to 10.6 times fossil jet fuel.
I write for equity investors at the feasibility stage, where the question is not whether SAF is cheaper but which line of the model deserves scrutiny. Everything below uses published figures only, with the source named next to each one.
In short
- Feedstock: a 1 percent price move shifts the HEFA selling price by 1 percent (IRENA).
- Capital: lowest for HEFA, high or very high for Alcohol-to-Jet, Fischer-Tropsch and power-to-liquid (IATA).
- Operations: 84 employees per plant assumed, 52 for HEFA (IRENA).
- Financing: up to 5 years to final investment decision, the point capital is committed, and fewer than 30 percent of projects reach it (ICCT).
- Policy: EU reference prices set penalties, and UK grants exceed 200 million pounds (EASA; ICCT).
In this article
The short answer: the cost stack
I read the production cost of SAF as eight separate drivers rather than one number. IATA lists them as feedstock cost and composition, the capital cost of a proposed process, overall yield (conversion), quality and composition of the produced SAF, operating expenses, financial requirements, logistics and initial resources. Those are the eight cost drivers IATA says need stronger policy support in the medium term. The dominant line changes with the pathway: a waste oil plant lives on feedstock, an e-fuel plant on capital and electricity. EASA estimated the average production cost in 2024 at 1 461 euros per tonne for biofuels and 7 695 euros per tonne for e-fuels. The ICCT converts those figures into a cost premium of 2.1 to 10.6 times compared with fossil jet fuel. Neither figure is a market price: both are estimated average production costs. What this means for you: I would refuse any model that shows one blended cost number, because the drivers behind those two euro figures are structurally different.
Feedstock: the line that moves with the market
Feedstock is the raw material entering the plant, and it is where most of the variability sits. The ICCT states that the cost of SAF is primarily driven by the cost of its feedstock: virgin vegetable oil is more expensive than the kerosene it displaces, and waste-based SAF with high cellulosic content is expensive because of inefficient supply chains and the enzymes needed to break it down. For oil-based SAF through HEFA, a 1 percent increase in feedstock price results in a 1 percent rise in the minimum jet fuel selling price, the lowest price at which the producer covers cost (IRENA). Lignocellulosic pathways are less sensitive to feedstock and more reliant on capital expenditure, the money spent building the plant. IATA lists feedstock cost and composition first and marks HEFA operational cost as high when feedstock is constrained. My note on where those feedstocks actually sit is feedstock availability in Southeast Asia. What this means for you: I would stress feedstock first, since it moves selling price almost one for one.
Capital: pioneer plant, then nth plant
The second line is the money you spend before a litre is sold. Capital expenditure is high for Alcohol-to-Jet, Gasification-Fischer Tropsch and Power-to-Liquid, and lowest for HEFA, which benefits from existing renewable fuel production capacity and proven technology and is usually a retrofit rather than a new refinery (World Economic Forum and Kearney; IATA). The World Economic Forum and Kearney put the industry’s requirement between 19 billion and 45 billion US dollars of capital expenditure by 2030, depending on the technology mix. IRENA models a pioneer plant, the first commercial unit of a pathway, at 250 000 tonnes of SAF per year for HEFA, against a nameplate capacity of 2 000 tonnes of feedstock per day for the other pathways. The nth plant, the unit built after the design has been repeated, carries a lower cost through that learning effect. What this means for you: I would always ask whether the model assumes a pioneer plant or an nth plant, because that answer changes the capital line completely.
Conversion, operations and financing
The third line is running the plant and paying for it. Operating expenses cover labour and overheads: IRENA assumed a consistent 84 employees per plant for all processes except HEFA, which it assumed at 52 employees because the process is notably simpler. IATA marks operational cost as low to medium for Alcohol-to-Jet, Fischer-Tropsch and power-to-liquid from industrial waste carbon, and high for power-to-liquid from direct air capture carbon, with capital cost very high because the technology is still immature. Financial requirements are a cost driver in their own right. It takes up to 5 years for a project to reach final investment decision and fewer than 30 percent of SAF projects globally had reached it as of early 2025 (ICCT). ICCT notes that projects often come apart between demonstration and commercialization because of poor project financing or unforeseen technical barriers. I follow the same money later in e-SAF project finance. What this means for you: I would book the development years as a cost line, not as a gap in the schedule.
What a buyer actually pays
The SAF production cost meets the market through a pricing mechanism. SAF prices can range between 2 to 5 times that of conventional aviation fuel depending on technology pathway and chosen feedstock (IATA), and today SAF generally costs between 2 and 5 times more than fossil jet fuel (ICCT). IATA records that SAF prices exceed fossil-based jet fuel by a factor of two and by up to a factor of five in mandated markets, adding 3.6 billion US dollars in fuel costs for the industry in 2025. Three structures carry the risk differently: a SAF premium marked to a conventional fuel index leaves the airline exposed to conventional fuel volatility, a cost plus model transfers variable cost risk including feedstock to the customer, and price reporting agency assessments are generally more expensive until the market is liquid (IATA). I set those contracts out in sustainable aviation fuel price. What this means for you: I would read the pricing clause as closely as the cost model, because it decides who absorbs a feedstock spike.
The regional cost base
Location changes the answer as much as the process does. IRENA models capital expenditure per litre of SAF for nth plants in Indonesia, Malaysia and Thailand: a Fischer-Tropsch plant in Malaysia is the highest of the three, nearing 9.5 US dollars per litre of SAF, while the HEFA plant in Indonesia is the lowest at 0.7 US dollars per litre, the difference coming mainly from variations in purchasing power parity. On selling price, IRENA puts HEFA between 1.6 and 2.1 US dollars per litre against fossil Jet-A1 at 0.6 US dollars per litre, alcohol-to-jet from Thai sugarcane at around 1.6 US dollars per litre, and Fischer-Tropsch from Indonesian rice husk at 1.2 US dollars per litre once nth plant status is achieved. Fischer-Tropsch remains uncompetitive until nth plant status is achieved, which IRENA calls a major barrier in a region where financial resources for decarbonisation are limited. What this means for you: I would build the cost base on the country of the plant, never on a regional average.
How policy rewrites the cost
Policy changes the number as much as the process does. ReFuelEU Aviation requires EASA to publish reference prices annually from 2025 under Article 13 of Regulation (EU) 2023/2405, and the 2024 average prices released on 25 February 2025 are the reference Member States use to set penalties and to run the support mechanism under the EU ETS Directive. Grants and revenue support work from the other side: the United Kingdom has put more than 200 million pounds of upfront grant funding into second-generation SAF projects through the Advanced Fuels Fund, and its revenue certainty mechanism lets producers contract for 15 years at a fixed guaranteed strike price, taking effect by the end of 2026 (ICCT). E-fuel costs should come down when they reach the market around 2030 but are expected to remain far above fossil jet fuel. I set the mandate side out in ReFuelEU Aviation. What this means for you: I would run the published reference prices through my penalty assumptions before I sign an offtake.
How I would run this if it were my file
I would build the model line by line instead of borrowing a single blended number, because the dominant line differs by pathway (IATA). I would stress feedstock first, since a 1 percent move in feedstock price moves the minimum jet fuel selling price by 1 percent for HEFA (IRENA). I would separate pioneer cost from nth plant cost and say which one I am underwriting, since Fischer-Tropsch only becomes competitive at nth plant status (IRENA). I would treat the path of up to 5 years to final investment decision as a cost rather than a delay, since fewer than 30 percent of projects make it (ICCT). I would check the policy stack against the model before I sign, because penalties and support mechanisms are priced off published reference prices, set out in how to finance a SAF project. What this means for you: I would bring that line-by-line model to the first meeting, so every number carries a source and a pathway.
Sources
- IATA, SAF Handbook, May 2024.
- World Economic Forum and Kearney, February 2025.
- International Council on Clean Transportation, 6 October 2025.
- EASA, 25 February 2025.
- IRENA, December 2024.
- IATA Press Release No 57, 9 December 2025.
Frequently asked questions
What makes up the production cost of SAF?
IATA lists eight drivers: feedstock cost and composition, the capital cost of the process, overall conversion yield, quality and composition of the produced fuel, operating expenses, financial requirements, logistics and initial resources. Which of them dominates depends on the pathway, so I read the list line by line rather than as one total. Logistics and initial resources sit on that same list.
Why is feedstock the biggest cost driver?
Because the cost of SAF is primarily driven by the cost of its feedstock, and for oil-based SAF through HEFA a 1 percent increase in feedstock price produces a 1 percent rise in the minimum jet fuel selling price (ICCT; IRENA). Waste-based routes also carry inefficient supply chains and the enzymes needed to break down the raw material (ICCT).
Why do e-fuels cost so much more than biofuels?
E-fuels require high quantities of renewable electricity to produce hydrogen through electrolysis and to extract diluted carbon dioxide from the atmosphere (ICCT). The estimated average production cost for 2024 was 7 695 euros per tonne for e-fuels against 1 461 euros per tonne for biofuels (ICCT, citing EASA).
How does the pathway change the cost structure?
HEFA has the lowest capital expenditure because it builds on existing renewable fuel production capacity, while Alcohol-to-Jet, Fischer-Tropsch and power-to-liquid all require new capacity and carry high or very high capital cost (IATA; World Economic Forum and Kearney). The World Economic Forum and Kearney expect HEFA to dominate production to 2030, while HEFA carries high operational cost where feedstock is constrained (IATA).
Not sure your project would survive a credit conversation?
A short call is usually enough to see where your project stands.
If you want that line-by-line build for your own file, feasibility and financial model is where I do it: I take the pathway, the country and the policy stack, and return a cost model in which every line carries a source.
I do not provide investment advice or arrange investments. I act as a strategic advisor and facilitator.
Alex, Founder of WeConnect Asia
I help low-carbon fuel and carbon removal project developers in Southeast Asia secure the commercial and financial partners needed to reach FID.
Related articles

Pitching a Climate Tech Company to Strategic Investors: What the Corporate Has to Believe Before It Writes a Cheque
How to pitch a climate tech company to strategic investors: the metric cluster, the readiness evidence and the ask that corporates fund.
Biomethane: What It Is, How It Is Made and Who Buys It
Biomethane is biogas cleaned to pipeline quality. I explain how it is made, how it differs from biogas and who buys it in Southeast Asia.
CO2 Sourcing for e-SAF Projects: What the Rules Allow and What the Contract Must Say
Biogenic CO2, direct air capture or industrial flue gas: which sources an e-SAF plant may use, what they cost and which contract terms make the fuel certifiable.
Operating Performance Guarantees for SAF Plants: What Lenders Ask For
Minimum guarantees, performance damages, retesting and who stands behind them: the operating guarantees a SAF plant needs to keep debt and offtake intact.
EPC and Construction Risk in SAF Plants: What a Lender Actually Tests
FEED scope, convertible EPC, performance guarantees and damages caps: the construction risk questions a SAF project must answer before financial close.

Matching Feedstock and Offtake Risk Back-to-Back in a SAF Project: How Lenders Read the Chain
Lenders do not buy a feedstock plan and an offtake plan separately. They buy the link between the two, and the link is where most SAF files break.