
Home » Biogas Feedstock in Southeast Asia: What a Project Can Actually Secure
Biogas Feedstock in Southeast Asia: What a Project Can Actually Secure
10 min read · Apr 6, 2026 · By Alex
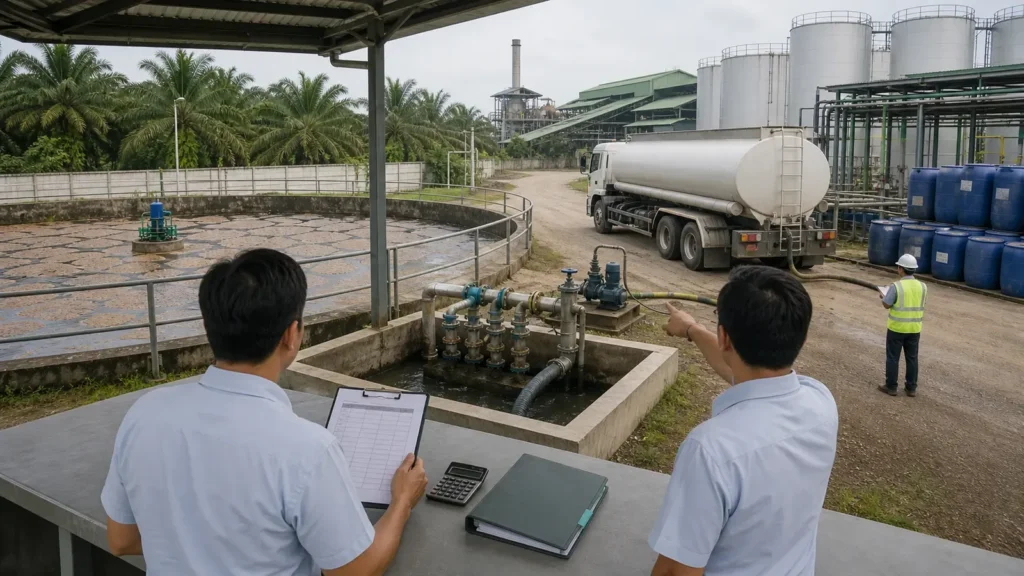
I am at pre-FID, so the first question is what I can sign for, and I start from the published record on the biogas, biomethane and biofuels industry. The region holds real but concentrated feedstock: developing Asia holds around 30 percent of the global sustainable biogas potential of nearly 600 Mtoe in 2020 figures, palm oil mill effluent is the signature stream with more than 450 mills in Malaysia and 850 in Indonesia, and capture is still partial at around 28 percent of Malaysian mills at the end of 2020 and less than a tenth of Indonesian mills in 2019. Biogas feedstock in Southeast Asia is therefore a contract and radius question, not a tonnage question.
I take the article in four moves: what the region holds, what the mills actually capture, what collection costs once material has to move, and the checks I run before I treat a supply as secured. Each section closes with the same line, so you can go straight to the part you need.
In short
- Resource: Developing Asia holds around 30 percent of nearly 600 Mtoe of sustainable potential in 2020 figures.
- Signature stream: Effluent gives 28-34 m3 of biogas per m3 at 54 to 65 percent methane.
- Capture: About 28 percent of Malaysian mills at the end of 2020, less than a tenth of Indonesian mills in 2019.
- Cost: Bioenergy electricity reached USD 0.087/kWh in 2024, 19 percent above the 2023 value.
- Test: Count contracted sites, capture status and haulage distance before you count tonnes.
In this article
What the feedstock question actually is
Feedstock is the organic material I feed into a digester, biogas is the gas that material produces when it breaks down without oxygen in a process called anaerobic digestion, palm oil mill effluent is the liquid discharge leaving a palm oil mill, and collection radius is the distance over which I contract and haul material before it reaches the plant. Those four words carry the argument below.
The tonnes are not the constraint. What binds a project before final investment decision is committed tonnage: how many sites stand behind the volume, whether capture equipment exists today or only appears in an announced plan, and what haulage distance an offered price assumes. A national resource estimate describes what could be gathered over decades. A capture rate describes what is gathered now, and a collection radius describes what happens to cost when I widen the circle. I would take a smaller volume with signed sites over a large estimate with no plant attached.
What this means for you: open every feedstock claim with two questions, capture rate and haulage distance, because those decide whether a supply agreement can be drafted at all.
What the region holds
In the IEA biogas and biomethane outlook published in 2020, nearly 600 Mtoe of biogas could be produced sustainably, with developing economies holding two-thirds of the global potential, developing Asia around 30 percent, and Central and South America another 20 percent. Biomethane, which I define as biogas upgraded to grid quality, sits on that same base; the mechanics are in how biomethane differs from raw biogas.
Yield per tonne is where the resource stops being uniform. Industrial waste gives the highest yield at around 0.40 toe per tonne, while manure is the most common feedstock worldwide but yields significantly less per tonne than crop residues.
By 2040 the sustainable potential is 50 percent higher than in 2020, with crop residues above 40 percent and animal manure 35 percent of the total. Manure availability grows about 2.5 percent a year, double the rate of crop residues, while municipal solid waste in India and Southeast Asia reaches 36 Mtoe, three times the 2020 assessment.
What this means for you: choose a stream by yield per contracted tonne, not by national potential, and confirm the 2040 growth lands inside your collection radius.
Palm oil effluent, the stream the region is known for
A palm oil mill generates about 2.5 to 3.0 m3 of effluent per tonne of crude palm oil. In the 2026 review in the journal Biomass, that effluent yields roughly 28-34 m3 of biogas per m3 at 54 to 65 percent methane, and carries a chemical oxygen demand of 15,000 to 100,000 mg/L.
Co-digestion, meaning the addition of a second material into the same digester, improves the picture: in reported batch tests, mixing empty fruit bunches with effluent raised methane production by 25 to 32 percent against single-substrate digestion, and other studies report biogas gains of about 20 to 40 percent depending on substrate, mix ratio and pretreatment. Those are batch results, not operating figures.
Malaysia produced about 20.26 million tonnes of crude palm oil in 2025 on 5.7 million hectares, and if every mill captured its effluent the electricity potential is estimated at more than 500 MW, which is a potential rather than installed capacity. I weigh it against the economics of feedstock choice.
What this means for you: size the stream from mill throughput and effluent ratio, not from a national palm oil figure.
What the mills actually capture
Malaysia gives the cleanest read on what is running. Around 130 of 450 mills had capture at the end of 2020, about 28 percent, and 135 of 451 in the 2021 assessment, about 30 percent, against roughly 55 in the early 2010s; in 2016 the count was 92 of 450. Those installations carry about 168 MW against a national potential near 508 MW and avoid about 4.96 million tonnes of CO2 equivalent a year.
The 2020 policy brief from the Energy Studies Institute at the National University of Singapore records the wider picture: in Indonesia less than a tenth of 850 mills had capture in 2019, while Malaysia and Indonesia together supply nearly 90 percent of the global palm oil offer. Thailand had most mills equipped by 2012 under a scheme opened in 2002 at THB 2.8/kWh, an early feed-in tariff, meaning a guaranteed price for power delivered to the grid.
What this means for you: ask for the mill list behind the percentage, because 30 percent of mills is not 30 percent of effluent if the equipped sites are the small ones, and read why clustering mills changes the economics before you price one site.
What supply costs once you have to collect it
In the IRENA cost review published in 2025, bioenergy electricity commissioned in 2024 had a levelised cost of USD 0.087/kWh, 19 percent above the 2023 value of USD 0.073/kWh, on feedstock price volatility and logistics costs. Variable operation and maintenance costs average around USD 0.004/kWh in 2024.
Plant size is a trade-off: feedstock gets dearer as average collection distance grows, so scale economies and haulage cost pull in opposite directions. The most competitive projects use residues already sitting at an industrial processing site, where marginal feedstock cost is minimal or zero.
Capacity factors averaged 66 percent in China, 81 percent in Europe, 68 percent in India and 85 percent in North America over 2000 to 2024, so a low factor is not automatically a feedstock problem.
What this means for you: draw the haulage cost curve before you fix plant size, then check that how biogas power plants are configured in the region still holds at the radius your price assumes.
What the molecule has to be sold as
Biogas is sold as heat, electricity, vehicle fuel or chemical feedstock, and upgraded biomethane can go to the grid. Digestate, the residue left after digestion, returns almost all nutrients to soil, and carbon dioxide from upgrading can replace fossil product in food, chemicals and power-to-gas.
In the IEA Bioenergy Task 37 country report of September 2024, China runs more than 100,000 biogas plants and Germany over 10,000, with Germany producing about 87 TWh a year; in most countries production has depended on investment support or subsidies to be financially viable.
A Danish plant draws substrates from 70 farms inside 30 km, showing a tight collection radius in practice. In the United Kingdom, biomethane capacity reached 103,174 m3/h in 2022 under a 15-year index-linked feed-in tariff paying 5.51 p/kWh on the first 60 GWh, 3.53 p/kWh on the next 40 GWh and 1.56 p/kWh after that.
What this means for you: decide the sales molecule first, because grid injection, power sales and heat offtake carry different support exposure, with the demand side covered in the biomethane market in Southeast Asia.
What I would test before I call a feedstock secured
Five checks I write down before I let a resource number into a model, in this order:
- Sites: how many individual sites stand behind the tonnage, and are they contracted or only counted on a map?
- Capture: does collection equipment run today, or does it exist only as an announced obligation with a date attached?
- Radius: what average haulage distance does the offered price assume, and what does cost do when I widen it?
- Support: does the price still work when the tariff or the subsidy ends, and who carries that transition?
- Side streams: is digestate and carbon dioxide revenue modelled at all, since those revenues are usually modest and rarely close the gap to natural gas on their own.
What this means for you: run all five before you circulate a resource table, because a failure on any one of them changes the contract you can actually sign.
How I would present the feedstock case in a credit paper
I put four dated rows on the first page, each tied to the year it was published:
- Resource: developing Asia holds around 30 percent of the global sustainable potential of nearly 600 Mtoe in 2020 figures.
- Capture: less than a tenth of 850 Indonesian mills had capture in 2019, and around 28 percent of 450 Malaysian mills at the end of 2020.
- Yield: 28-34 m3 of biogas per m3 of palm oil mill effluent at 54 to 65 percent methane, on 2026 data.
- Cost pressure: a levelised cost of USD 0.087/kWh in 2024, 19 percent above the 2023 value of USD 0.073/kWh.
Those four rows do different jobs. The first sizes the prize, the second shows how little of it is currently gathered, the third converts a mill into a volume I can model, and the fourth sets the price the molecule has to beat. I also define bankable in plain words beside the supply table: bankable means a supply a lender will underwrite, which in practice means contracted sites, an operating capture plant, and a radius the offered price survives.
What this means for you: present resource, capture, yield and cost as four separate dated claims, so no reader can mistake an estimate for a signed volume.
Sources
- IEA, Outlook for biogas and biomethane, 2020.
- IRENA, Renewable power generation costs in 2024, 2025.
- Energy Studies Institute, Producing Biogas from Palm Oil Mill Effluent in Southeast Asia, 2020.
- MDPI Biomass, Biogas Recovery from Palm Oil Mill Effluent in Malaysia, 2026.
- IEA Bioenergy Task 37, A perspective on the state of the biogas industry in 12 member countries, 2024.
Frequently asked questions
What is the best biogas feedstock in Southeast Asia?
The one a project can contract at short radius. Residues already sitting at an industrial processing site carry minimal or zero marginal cost, palm oil effluent is abundant wherever mills exist, and livestock manure is the most common feedstock globally but yields significantly less per tonne than crop residues. Industrial waste gives the highest energy yield at around 0.40 toe per tonne, so I rank candidate streams by yield per contracted tonne rather than by national availability.
How much biogas does palm oil mill effluent produce?
About 28-34 m3 of biogas per m3 of effluent at 54 to 65 percent methane, on 2026 data. That effluent is generated at about 2.5 to 3.0 m3 per tonne of crude palm oil, and it carries a chemical oxygen demand of 15,000 to 100,000 mg/L. In reported batch tests, adding empty fruit bunches raised methane production by 25 to 32 percent against single-substrate digestion.
Why are so few mills capturing biogas?
Capital and infrastructure. Capture reached about 28 percent of Malaysian mills at the end of 2020 and less than a tenth of Indonesian mills in 2019, because high capital and operating cost kept capture unattractive until incentives arrived in the 2000s, and remote mills still face grid connection cost and weak local demand. Thailand had most mills equipped by 2012 under a scheme opened in 2002 at THB 2.8/kWh.
Is biogas feedstock supply in the region secure?
Yes for availability, not yet for capture. Developing Asia holds around 30 percent of the global sustainable potential of nearly 600 Mtoe in 2020 data, while capture sits at about 30 percent of 451 Malaysian mills in the 2021 assessment. Availability is not a signed volume: contract, radius and support exposure decide what a single project can actually take.
Not sure your project would survive a credit conversation?
A short call is usually enough to see where your project stands.
If you want a second read on a candidate stream before you commit study budget, I run that screen as a short assignment: site count, capture status, radius and support exposure, in that order, using the same five checks above. The work sits in my feedstock supply service, and I am happy to start from a mill list you already hold.
I do not provide investment advice or arrange investments. I act as a strategic advisor and facilitator.

Alex, Founder of WeConnect Asia
I help low-carbon fuel and carbon removal project developers in Southeast Asia secure the commercial and financial partners needed to reach FID.
Related articles

Pitching a Climate Tech Company to Strategic Investors: What the Corporate Has to Believe Before It Writes a Cheque
How to pitch a climate tech company to strategic investors: the metric cluster, the readiness evidence and the ask that corporates fund.
Biomethane: What It Is, How It Is Made and Who Buys It
Biomethane is biogas cleaned to pipeline quality. I explain how it is made, how it differs from biogas and who buys it in Southeast Asia.
CO2 Sourcing for e-SAF Projects: What the Rules Allow and What the Contract Must Say
Biogenic CO2, direct air capture or industrial flue gas: which sources an e-SAF plant may use, what they cost and which contract terms make the fuel certifiable.
Operating Performance Guarantees for SAF Plants: What Lenders Ask For
Minimum guarantees, performance damages, retesting and who stands behind them: the operating guarantees a SAF plant needs to keep debt and offtake intact.
EPC and Construction Risk in SAF Plants: What a Lender Actually Tests
FEED scope, convertible EPC, performance guarantees and damages caps: the construction risk questions a SAF project must answer before financial close.

Matching Feedstock and Offtake Risk Back-to-Back in a SAF Project: How Lenders Read the Chain
Lenders do not buy a feedstock plan and an offtake plan separately. They buy the link between the two, and the link is where most SAF files break.