Home » Green Ammonia Projects in Southeast Asia: The Developers Map I Actually Use
Green Ammonia Projects in Southeast Asia: The Developers Map I Actually Use
10 min read · Dec 2, 2025 · By Alex
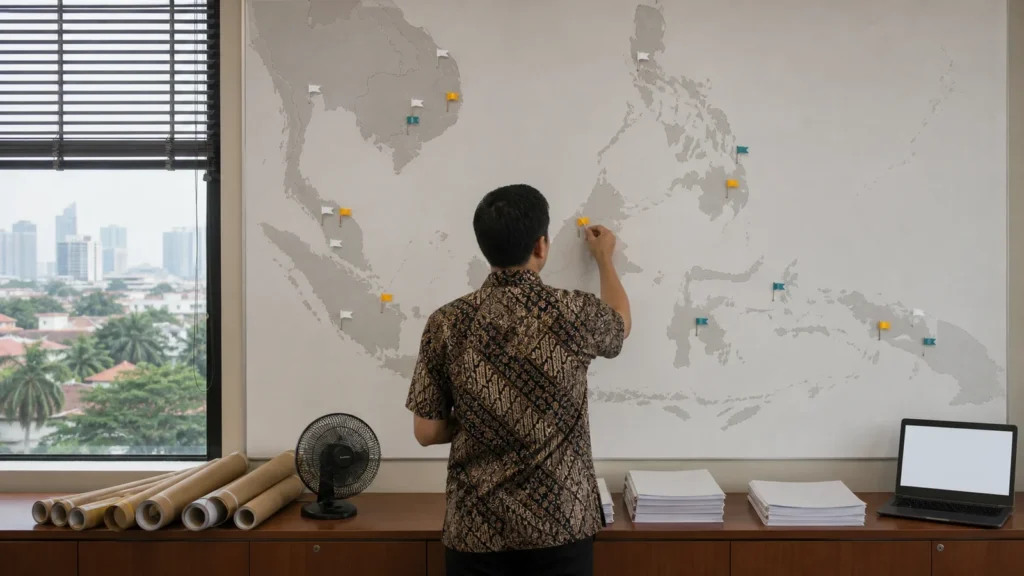
Before I open a file on any developer building in this region, I look for a stage column first. That habit is why I keep the green ammonia guide open while I work. The honest map of green ammonia projects in Southeast Asia is a map of stages rather than of operating plants: as at May 2025 there was no large-scale commercial green hydrogen project operating anywhere in Southeast Asia, and in the December 2025 count only 6 per cent of announced capacity, that is, capacity a company has declared it intends to build, had reached a final investment decision, the moment owners commit the money. So I read every name against its stage, its offtaker, the party bound to buy, and its certification route.
So I will order this the way I work: how the regional picture looks stage by stage, who is doing what by country, and what the global pipeline shows. Then I set out the stages that separate an announcement from a plant, what the buyer side looks like, what the capital asks, and the checks I run on any name.
In short
- Stage: No large-scale commercial green hydrogen plant was operating in Southeast Asia as at May 2025, and only 6 per cent of announced capacity had reached a final investment decision by December 2025.
- Region: 4 Mt of hydrogen demand in 2024, with ammonia first at 49 per cent, Indonesia at 35 per cent and Malaysia at 22 per cent.
- Pipeline: More than 300 Mtpa of low-carbon ammonia announced in May 2025 against a 200 Mtpa conventional market, and only 48 projects at the decision.
- Buyer: 7 Mtpa of offtake announced between 2021 and 2025, of which 1.6 Mtpa was firm.
- Capital: The announced pipeline for 2030 fell to 27 Mt, and 22 Mt needs an investment decision by early 2027.
In this article
What a developers map is really showing
A developers map lists projects by sponsor rather than by stage, which is useful for a first scan and wrong for everything after it. The words I need defined on the page: front-end engineering design is the engineering pass that fixes the design and the cost before the decision; a certification scheme records the carbon intensity of the molecule; a retrofit adapts an existing plant instead of building new; take-or-pay makes the buyer pay for the contracted volume; a bankable project is one a lender will model and fund; the marginal producer is the high-cost producer that sets the price.
A list with no stage column is a directory, and I have never seen a directory survive a lender’s first question (2025). So I keep the sibling map of hydrogen projects across Southeast Asia open next to it, because hydrogen names and ammonia names move between the two lists.
What this means for you: a sponsor list buys you a conversation, not a file. I ask for the stage, the engineering status and the decision date before I ask for anything else, and a name that cannot answer sits at the bottom of my list.
The regional picture, stage by stage
The December 2025 Southeast Asia briefing counts 4 Mt of hydrogen demand in 2024 against 5 countries with a national strategy. Ammonia takes 49 per cent of that demand, refining 31 per cent and methanol 20 per cent; by country Indonesia holds 35 per cent, Malaysia 22 per cent, Viet Nam 15 per cent and Singapore 12 per cent. Announced projects in the region equal 12 per cent of current regional demand, and only 6 per cent of announced capacity had reached a final investment decision. Regional potential of nearly 11 Mtpa below 6 USD/kg by 2030 sits mostly in Indonesia. As at December 2025 no certification scheme is yet in place in the region, with work under way in three countries, and a high cost of capital is named as the main barrier.
This is the picture I put in front of any list of names (December 2025).
What this means for you: a regional total sizes the prize, it does not identify a builder. I use the demand split and the 6 per cent at the decision to set my own expectations before I dial any number, and I discount any list that quotes regional demand without that second figure.
Who is doing what, by country
The ISEAS Perspective of May 2025 reports that there is to date no large-scale, commercial green hydrogen project operating in Southeast Asia, while pilot projects and initiatives are underway, most notably in Malaysia and Indonesia. Sarawak carries the ambitions cited for Malaysia; a joint development agreement was signed on 21 October 2024 between Sembcorp and PT PLN EPI for what Sembcorp presents as Southeast Asia’s largest green hydrogen project; an alliance between EGAT, EDL, Chiyoda and Mitsubishi for green hydrogen and ammonia in Thailand was announced on 5 July 2024. The challenges it lists run from electrolyser cost and reliability, through market mechanisms, legislation, safety protocols and transport and storage infrastructure, to harmonisation of international standards and certification, underdeveloped renewable capacity, and competition from other low-carbon solutions. The same paper reports that the use of hydrogen and ammonia in Southeast Asia will remain small in 2050 under both scenarios on cost grounds, and that Indonesia targets 24.2 billion USD of private investment in green hydrogen by 2060. I read those against the Southeast Asia ammonia market page.
In this region the map is still mostly a map of agreements, not of steel (May 2025).
What this means for you: I ask any developer here which of the agreements named above its own project hangs from, what moved after 5 July 2024, and whether the renewable capacity behind it exists on paper or on the grid.
What the global pipeline looks like
In May 2025 the Hydrogen Council and McKinsey roadmap counted more than 300 Mtpa of low-carbon ammonia projects announced, already above the 200 Mtpa conventional market, while only 85 projects representing 35 Mtpa had reached front-end engineering design and 48 projects representing 15 Mtpa had reached a final investment decision, of which 1.3 Mtpa of retrofits were already online. Three barriers are named: competitiveness against conventional supply, difficulty in tracking emission reductions, and the absence of long-term offtake. Demand aggregation mechanisms reduce counterparty risk, create bankable offtake volumes and move producers from engineering design to the decision. 35 GW of electrolysis is expected worldwide by 2030. I hold those figures against how a green ammonia plant is actually built.
The gap between the announced column and the decision column is the whole subject of this article (2025).
What this means for you: when a developer quotes me an announced capacity, I ask which of the three columns it sits in today, and I write that answer down before I write down the name.
Which stage separates an announcement from a plant
The BloombergNEF and Climate Technology Coalition paper tracks 185 low-carbon ammonia projects, of which 45 had purchase agreements and 15 were under construction or had secured financing, while only 8 per cent of announced low-carbon hydrogen projects targeting ammonia had reached financial close or construction. World ammonia capacity stood at 243 million tonnes a year in 2024 with utilisation around 80 per cent and plants lasting 20 to 50 years. Production costs run from 100 to 1,000 USD per tonne by region against an average of 305 USD per tonne since 2013, and the high-cost producer normally sets the world price. In 2024, 90 per cent of traded ammonia sat on short-term contracts of one to three years with a fixed quantity and a take-or-pay structure.
A project without a signed buyer is a study (2024).
What this means for you: I sort every name into one of three boxes, signed buyer, financed or building, announced only, and I refuse to talk price with anything left in the third box.
What the buyer side looks like
7 Mtpa of offtake was announced between 2021 and 2025, of which only 1.6 Mtpa was firm. 16.5 Mtpa of export projects were lined up for 2030, of which only 4.2 Mtpa had an identified buyer. The region is a net ammonia exporter where only Indonesia and Malaysia export, Malaysia accounting for 73 per cent of regional exports and the region for 17 per cent of world ammonia exports in 2023. Global low-carbon production reached almost 1 Mt in 2025 and is expected to pass 1 per cent of world production for the first time in 2026. I read all of it in the page on ammonia offtake in Southeast Asia.
The buyer column is the first column I read.
What this means for you: I ask who signs, for how long and at what volume, and I treat an announced offtake as nothing until a name and a quantity are attached to it. A signed agreement that nobody will put a quantity against is still a study, and it belongs in the same box as the rest.
What the capital asks before it travels
The 2026 review’s executive summary reports demand passing 100 Mt in 2025 while low-carbon production grew 20 per cent to almost 1 Mt. The announced pipeline fell to 27 Mt for 2030, projects with strong potential to operate in 2030 dropped from 10 Mt to just above 6 Mt, and 22 Mt risk losing any chance of starting operation by 2030 if investment decisions are not taken by early 2027, two-thirds of it in Europe, North America and Latin America. About 80 per cent of production with strong potential in 2030 targets chemicals, refining and low-emission fuels. The barriers cited are high costs, uncertain demand, slow or complex regulation and insufficient infrastructure. I weigh all of that next to the guide to financing a hydrogen project.
A name on a list is not a name on a schedule (2026).
What this means for you: I ask a developer what has to be true for a decision by early 2027, and if the answer is a rule that has not been written yet or a road that has not been built, I close the file.
The four checks I run before I save a name
- Check one, the stage: 85 projects at engineering design against 48 at the decision tells me which column a name belongs to (May 2025).
- Check two, the buyer: 1.6 Mtpa of 7 Mtpa announced between 2021 and 2025 was firm (December 2025).
- Check three, the certificate: no scheme was in place in the region with work under way in three countries (December 2025).
- Check four, the money: 8 billion USD went into hydrogen production investment in 2025 against 38 billion USD of public funding advanced and 6.6 billion USD of development lending committed between 2021 and 2025 (December 2025).
What this means for you: four questions, one page, and any name that fails one of them stays off my map until it does not. That is the whole method, it costs me an afternoon per name, and it is the only reason I trust my own list.
Sources
- ISEAS Perspective 2025 No. 33, Green Hydrogen in Southeast Asia: Connecting National Strategies with Public Support, ISEAS – Yusof Ishak Institute https://www.iseas.edu.sg/wp-content/uploads/2025/03/ISEAS_Perspective_2025_33.pdf, 5 May 2025.
- IEA, Global Hydrogen Review 2025, Southeast Asia, 9 December 2025 https://iea.blob.core.windows.net/assets/745a259b-9cb7-4e1d-9ba1-a8b63d1eaae8/GHR2025_SEA_Webinar.pdf, 2025.
- Hydrogen Council with McKinsey & Company, Fertilizing the future: A roadmap to scale low-emission ammonia fertilizers https://hydrogencouncil.com/wp-content/uploads/2025/11/Fertilizing-the-future-FINAL.pdf, November 2025.
- BloombergNEF and Climate Technology Coalition, Scaling Up Hydrogen: The Case for Low-Carbon Ammonia https://assets.bbhub.io/professional/sites/24/CTC-whitepaper_Ammonia_Final.pdf, January 2024.
- IEA, Global Hydrogen Review 2026, Executive summary https://www.iea.org/reports/global-hydrogen-review-2026/executive-summary, 2026.
Frequently asked questions
Are there operating green ammonia plants in Southeast Asia?
In the region the picture is early: as at May 2025 there was no large-scale commercial green hydrogen project operating anywhere in Southeast Asia, and in December 2025 only 6 per cent of announced low-carbon capacity had reached a final investment decision (2025).
How many announced ammonia projects reach a final investment decision?
Few: in May 2025, 85 projects representing 35 Mtpa were at front-end engineering design and 48 projects representing 15 Mtpa had reached the decision, out of more than 300 Mtpa announced against a 200 Mtpa conventional market (2025).
Which countries carry the most activity in the region?
Two countries dominate the activity: Indonesia accounted for 35 per cent and Malaysia 22 per cent of regional hydrogen demand in 2024, and in 2023 Malaysia alone represented 73 per cent of regional ammonia exports, with the region at 17 per cent of world exports (2023, 2024).
What should I check before I contact a developer?
Four things: the stage of the project, the existence of a firm buyer, since only 1.6 Mtpa of the 7 Mtpa of offtake announced between 2021 and 2025 was firm, the certification route, with no scheme in place in the region and work under way in three countries in December 2025, and the cost of capital, named as the main barrier in the same count (2025).
Not sure your project would survive a credit conversation?
A short call is usually enough to see where your project stands.
If you want a second set of eyes on a name before you open a file with a lender, that is the strategic partnerships work I do for developers, investors and buyers who need a stage map of the region rather than another list of announcements.
I do not provide investment advice or arrange investments. I act as a strategic advisor and facilitator.
Alex, Founder of WeConnect Asia
I help low-carbon fuel and carbon removal project developers in Southeast Asia secure the commercial and financial partners needed to reach FID.
Related articles

Pitching a Climate Tech Company to Strategic Investors: What the Corporate Has to Believe Before It Writes a Cheque
How to pitch a climate tech company to strategic investors: the metric cluster, the readiness evidence and the ask that corporates fund.
Biomethane: What It Is, How It Is Made and Who Buys It
Biomethane is biogas cleaned to pipeline quality. I explain how it is made, how it differs from biogas and who buys it in Southeast Asia.
CO2 Sourcing for e-SAF Projects: What the Rules Allow and What the Contract Must Say
Biogenic CO2, direct air capture or industrial flue gas: which sources an e-SAF plant may use, what they cost and which contract terms make the fuel certifiable.
Operating Performance Guarantees for SAF Plants: What Lenders Ask For
Minimum guarantees, performance damages, retesting and who stands behind them: the operating guarantees a SAF plant needs to keep debt and offtake intact.
EPC and Construction Risk in SAF Plants: What a Lender Actually Tests
FEED scope, convertible EPC, performance guarantees and damages caps: the construction risk questions a SAF project must answer before financial close.
Matching Feedstock and Offtake Risk Back-to-Back in a SAF Project: How Lenders Read the Chain
Lenders do not buy a feedstock plan and an offtake plan separately. They buy the link between the two, and the link is where most SAF files break.