
Home » Green Ammonia Price Premium: Who Actually Pays It
Green Ammonia Price Premium: Who Actually Pays It
10 min read · Feb 2, 2026 · By Alex
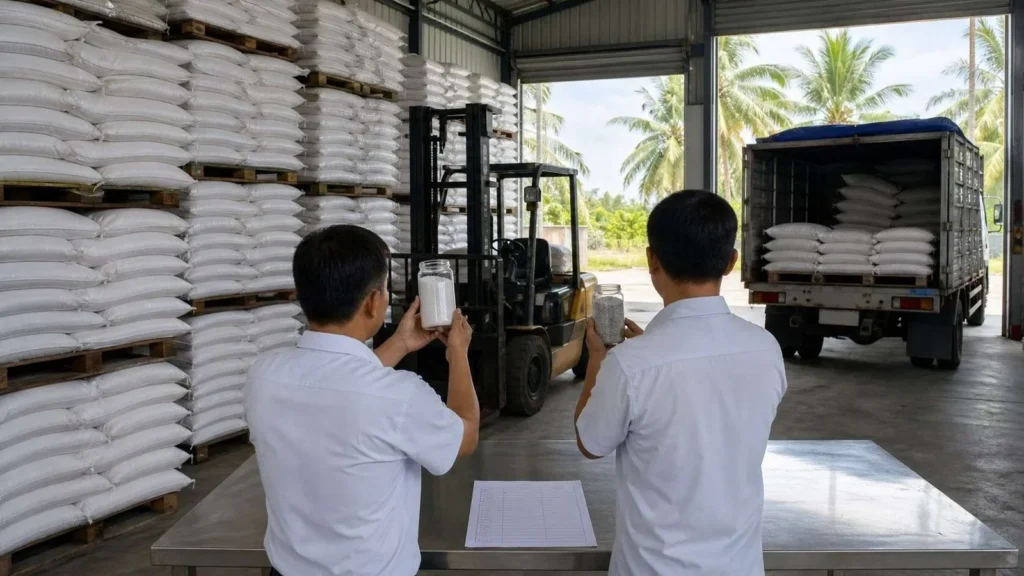
Five parties can end up carrying the gap between green ammonia and grey ammonia. The fertiliser maker, the food brand behind it, the government, the certificate buyer and the producer absorb the rest. In fact, today that gap is real. Low-carbon ammonia can cost two to three times grey ammonia in contracts described for 2024. Switching to it raises the cost of the finished product by only 1 to 3 percent in 2025. I write for an equity investor at feasibility stage who decides which line of the model takes that number. The green ammonia guide sets out the wider branch. The green ammonia price premium I am chasing here is a question of incidence, not of level: who signs for it.
Before I name the payers I order the question in four moves: what sits inside the premium, what buyers already pay, what shrinks it, and who finally carries it. Each move gets its own section, and the last one is the line I would write in a memo.
In short
- What the premium is: the distance a buyer is asked to absorb between a low-carbon tonne and a grey tonne.
- What sits inside it: fossil feedstock, renewable power, electrolysis and an assumed carbon cost.
- What buyers pay today: short-term contracts indexed to the monthly Tampa reference price.
- What shrinks it: cheaper renewable hydrogen and a high electrolyser load factor.
- Who carries it: fertiliser maker, food brand, government, certificate buyer and producer.
In this article
What the premium is
The short answer is concrete. Low-carbon ammonia can fetch two to three times grey ammonia in contracts described for 2024. Meanwhile, the finished product rises only 1 to 3 percent in 2025. Grey ammonia uses unabated fossil hydrogen. Instead, green ammonia uses electrolytic hydrogen, and blue ammonia uses fossil hydrogen with capture. The green premium is the price difference a buyer must absorb over the grey benchmark. Price indexation ties a contract to a published reference instead of a fixed number. Also, the Tampa benchmark is the monthly reference price for traded ammonia. A contract for difference pays the difference between an agreed floor and the market. A guarantee of origin certifies how a producer made a tonne. Book-and-claim lets a different party claim that attribute. In addition, free allocation is the share of carbon permits a producer receives without paying.
What this means for you: I measure every figure below against grey ammonia. As a result, the premium is a distance from a baseline, not an absolute price.
What sits inside the premium
The grey benchmark sets the floor. Production cost runs from 100 to 1,000 USD per tonne by region and averaged 305 USD per tonne since 2013, and China is normally the marginal producer, the high-cost plant that sets the world price in 2024. Inside that floor sits the feedstock, since 99 percent of ammonia production depends on fossil inputs, 72 percent natural gas and 26 percent coal in 2024, so a gas move is already in the grey price. Moreover, I add renewable power and electrolysis on top. In 2025 the switch downstream raises the finished product cost by 1 to 3 percent. It also cuts product emissions by up to 30 percent, against organic premiums of 20 to 40 percent.
A 2025 cost exhibit puts renewable auctions in India at about 600 USD per tonne of ammonia and assumes carbon costs of about 130 USD per tonne of carbon dioxide in 2030. The Southeast Asia and Singapore market page carries the regional version.
What this means for you: I never model the premium as one uplift, because feedstock, power and carbon move independently.
What buyers are used to paying
The reference for any premium is what buyers already accept. A BloombergNEF and Climate Technology Coalition white paper of January 2024 records a 76 billion USD market. The market reached 187 million tonnes in 2021. Specifically, fertilisers took 77 percent of demand and industrial uses 23 percent. Ammonia makes 54 percent of all fertilisers. Its production and use emit 2 percent of the world’s carbon dioxide. Ninety percent of traded ammonia moves on short-term contracts of one to three years with fixed quantity and take-or-pay, where the buyer pays whether or not it lifts the volume, priced off the monthly Tampa benchmark that follows natural gas.
Production costs run from 100 to 1,000 USD per tonne at an average of 305 USD since 2013, utilisation sits around 80 percent on 243 million tonnes of capacity in 2024, and five companies take up to 70 percent of traded volume out of about 820 firms. The offtake agreements page covers those structures.
What this means for you: I underwrite any premium against a buyer used to three-year, gas-indexed, take-or-pay terms, which is exactly what a long fixed-price green contract breaks.
What makes the premium shrink
Two forces do most of the work. Modelling for 2024 expects renewable hydrogen costs to fall 66 percent by 2030. That means 1 to 4.1 USD per kilogram. As a result, green ammonia sits at parity with grey in some markets in 2024-2025. It becomes cheaper than grey in more than half of 29 modelled markets from 2034. Modellers expect 35 GW of electrolysis capacity globally by 2030. In addition, new-build low-carbon plants already reach capture rates above 95 percent in 2025. In fact, a cheap renewable power price moves the number more than anything else. Also, a high electrolyser load factor. This is why the power contract is the first line I read in any model. The renewable fuels of non-biological origin page shows the same logic.
What this means for you: I test the premium against the power price and the load factor before I test it against any ammonia price.
Who carries the premium today
The Hydrogen Council and McKinsey roadmap of November 2025 covers half the 20 largest fast-moving consumer goods companies. Those companies carry 850 billion USD of food and beverage revenue and have set scope 3 targets. Therefore, pooled demand cuts counterparty risk and creates bankable offtake volumes. As a result, those volumes move a producer from front-end engineering design to final investment decision. I count five payers:
- 1. The fertiliser maker: passes 1 to 3 percent onto the finished product in 2025.
- 2. The food and beverage brand: whose scope 3 target funds the difference in 2025.
- 3. The government: it acts through carbon pricing, border adjustment and contracts for difference. It also shifts fertiliser subsidies, with a fixed premium auction from November 2023. Free allocation for ammonia and fertiliser producers ends, so a carbon price applies from 2026.
- 4. The buyer of environmental attributes: through guarantee of origin schemes in Denmark, the Netherlands and Australia and through book-and-claim.
- 5. The producer: who absorbs whatever is left.
The regional offtake page shows where these five meet.
What this means for you: I want a named payer on each line. Where only the producer remains, I treat the premium as unsold.
What I will not call a paid premium
The 2026 Global Hydrogen Review of the International Energy Agency shows low-carbon production up 20 percent in 2025. That is almost 1 Mt and should pass 1 percent of global production in 2026. Consequently, an announced pipeline sits at 27 Mt to 2030. Of that, 22 Mt risks losing its 2030 slot without an investment decision before early 2027. Four things I refuse to book as a premium. A forecast parity date is not a price, since green ammonia only beats grey in more than half of 29 modelled markets from 2034, in modelling for 2024. Announced capacity is not a sold tonne, with more than 300 Mtpa announced in May 2025 against 15 Mtpa at final investment decision. A subsidy is not a price. Spare capacity is not scarcity, with utilisation around 80 percent on 243 million tonnes of capacity in 2024.
What this means for you: I book the premium only when a payer signs it, and everything else in this section stays outside my revenue line.
What this means in Southeast Asia
The International Energy Agency Southeast Asia briefing of 9 December 2025 covers regional hydrogen demand. Demand stood at 4 Mt in 2024. Ammonia takes 49 percent of that demand, against refining at 31 percent and methanol at 20 percent. Meanwhile, Indonesia takes 35 percent of regional exports, Malaysia 22 percent, Viet Nam 15 percent and Singapore 12 percent. Only Indonesia and Malaysia export, Malaysia taking 73 percent of regional exports and the region 17 percent of world ammonia exports in 2023. Announced regional projects equal 12 percent of current demand. Meanwhile, only 6 percent of announced capacity has reached final investment decision, and 11 Mtpa of potential sits below 6 USD/kg by 2030. No certification scheme is yet in place, with work under way in three countries, and 6.6 billion USD of development finance institution loans flowed between 2021 and 2025.
A regional premium works only where someone can certify the tonne and anchor the demand. However, the barriers named in 2026 remain high costs, uncertain demand, slow or complex regulation and insufficient infrastructure. The low carbon fuels investment page explains how development finance covers those barriers.
What this means for you: I will not assume a regional premium until a certification scheme and an anchored buyer exist in the same market.
The four lines I would put in an equity memo
Line one, market: the World Bank and Energy Sector Management Assistance Program survey of February 2026 covers electrolyser projects. In fact, ammonia is the largest segment, at about 42 percent worldwide under construction. The second line, capital cost: installed electrolyser capacity was about 2.15 GW mid-2025. That is 0.2 percent of global hydrogen demand. Meanwhile, 16 GW sat under construction in February 2026 and 3.5 GW at final investment decision. Alkaline electrolysis runs 500 to 1,500 USD per kilowatt, while PEM runs 1,000 to 2,000. Line three, financing: less established technologies carry higher financing costs unless warranties or guarantees step in, in February 2026. Line four, the test: the best projects today are around 3 USD per kilogram. Also, most sit above it, in February 2026. Therefore, the premium in the model has to be a signed commitment rather than an assumption.
What this means for you: I write the premium as a contracted line with a payer name attached, and where that name is missing I cut the assumption rather than stretch it.
Sources
- BloombergNEF and Climate Technology Coalition, Scaling Up Hydrogen: The Case for Low-Carbon Ammonia https://assets.bbhub.io/professional/sites/24/CTC-whitepaper_Ammonia_Final.pdf, January 2024.
- Hydrogen Council with McKinsey & Company, Fertilizing the future: A roadmap to scale low-emission ammonia fertilizers https://hydrogencouncil.com/wp-content/uploads/2025/11/Fertilizing-the-future-FINAL.pdf, November 2025.
- IEA, Global Hydrogen Review 2025, Southeast Asia, 9 December 2025 https://iea.blob.core.windows.net/assets/745a259b-9cb7-4e1d-9ba1-a8b63d1eaae8/GHR2025_SEA_Webinar.pdf, 2025.
- IEA, Global Hydrogen Review 2026, Executive summary https://www.iea.org/reports/global-hydrogen-review-2026/executive-summary, 2026.
- World Bank, ESMAP, Electrolyzers for Hydrogen Production: Technical and Economic Characteristics https://documents1.worldbank.org/curated/en/099022326123011297/pdf/P506220-b45b0865-8706-4862-8792-d8cc71f84569.pdf, February 2026.
Frequently asked questions
How much more does green ammonia cost than grey ammonia?
Low-carbon ammonia can be priced at two to three times grey ammonia in the contracts described for 2024, while production cost across regions ranges from 100 to 1,000 USD per tonne and averaged 305 USD per tonne from 2013. The gap therefore depends on where the tonne is made and on what the buyer contracts for.
Who ends up paying the green premium?
Five parties: the fertiliser maker, the food and beverage brand whose scope 3 target funds it, the government through carbon pricing, border adjustment, contracts for difference or subsidy shifts, the buyer of environmental attributes through guarantee of origin or book-and-claim, and the producer absorbing the rest. In practice the producer carries what nobody else signs for.
Does the premium reach the price of food?
At the finished product level the increase is 1 to 3 percent, while the same switch cuts product emissions by up to 30 percent, which is far below the 20 to 40 percent premiums that organic products carry. The premium shows on the fertiliser invoice long before it shows at the shelf.
When does green ammonia become cheaper than grey?
Modelled parity arrives in some markets in 2024-2025 and green ammonia becomes cheaper than grey in more than half of 29 modelled markets from 2034, helped by renewable hydrogen costs falling 66 percent by 2030 to 1 to 4.1 USD per kilogram. That is a modelled path rather than a quoted price.
Not sure your project would survive a credit conversation?
A short call is usually enough to see where your project stands.
If you are at feasibility stage and want this number written into a term sheet rather than a slide, I offer offtake agreement structuring and I walk the model line by line with you.
I do not provide investment advice or arrange investments. I act as a strategic advisor and facilitator.

Alex, Founder of WeConnect Asia
I help low-carbon fuel and carbon removal project developers in Southeast Asia secure the commercial and financial partners needed to reach FID.
Related articles

Pitching a Climate Tech Company to Strategic Investors: What the Corporate Has to Believe Before It Writes a Cheque
How to pitch a climate tech company to strategic investors: the metric cluster, the readiness evidence and the ask that corporates fund.
Biomethane: What It Is, How It Is Made and Who Buys It
Biomethane is biogas cleaned to pipeline quality. I explain how it is made, how it differs from biogas and who buys it in Southeast Asia.
CO2 Sourcing for e-SAF Projects: What the Rules Allow and What the Contract Must Say
Biogenic CO2, direct air capture or industrial flue gas: which sources an e-SAF plant may use, what they cost and which contract terms make the fuel certifiable.
Operating Performance Guarantees for SAF Plants: What Lenders Ask For
Minimum guarantees, performance damages, retesting and who stands behind them: the operating guarantees a SAF plant needs to keep debt and offtake intact.
EPC and Construction Risk in SAF Plants: What a Lender Actually Tests
FEED scope, convertible EPC, performance guarantees and damages caps: the construction risk questions a SAF project must answer before financial close.

Matching Feedstock and Offtake Risk Back-to-Back in a SAF Project: How Lenders Read the Chain
Lenders do not buy a feedstock plan and an offtake plan separately. They buy the link between the two, and the link is where most SAF files break.