
Home » Waste Composition and Calorific Value: The Check That Decides Whether Your Plant Runs
Waste Composition and Calorific Value: The Check That Decides Whether Your Plant Runs
10 min read · Jan 26, 2026 · By Alex
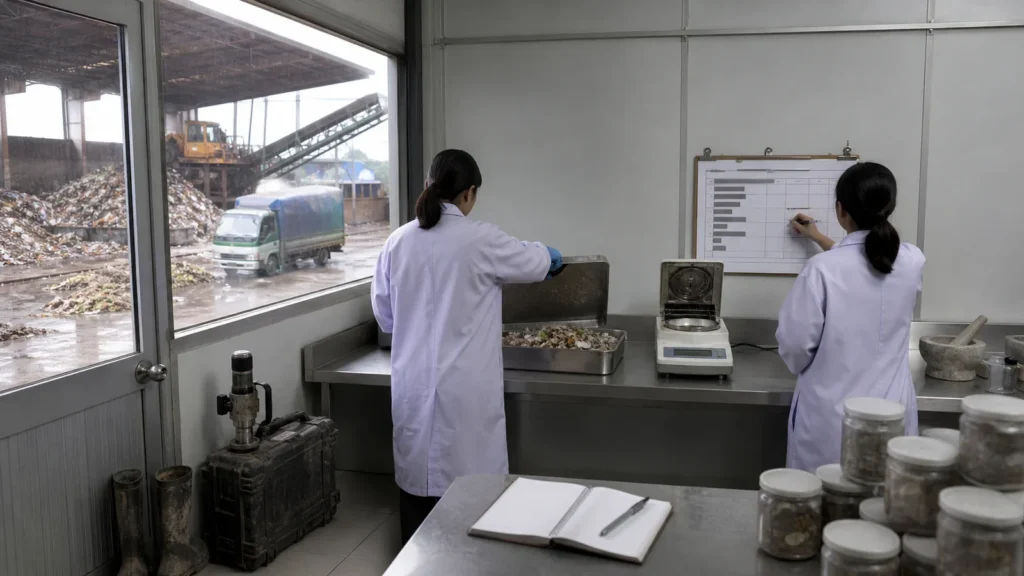
You can tell from two numbers whether local waste fits the technology: the lower heating value (the energy released per kilogram when the waste burns, water vapour excluded) averaged over the year, and its floor in the worst month. The published entry test, set in 2013, is strict: at least 100,000 tonnes a year of combustible waste, an average of at least 7 MJ/kg that never falls below 6 MJ/kg, which is why I read the waste analysis before I read the financial model. Waste calorific value is therefore the first gate in any waste-to-energy file I open, ahead of the tariff and the gate fee.
I work through that file in a fixed order: the entry thresholds, the study that produces the number, what one country’s waste looks like, how I read a composition table, what the figure changes in the model, then how I review the data handed to me. The first two settle everything downstream.
In short
- Entry test: At least 100,000 tonnes a year of combustible waste (2013), at least 7 MJ/kg on average, never below 6 MJ/kg.
- Study: One full year covering wet and dry seasons (2025), sampled top-down and bottom-up where the waste lands.
- Feedstock: More humid and less sorted waste cuts calorific value, combustion yield and availability (2026).
- Model: The figure sets tonnage, output and the revenue I can defend.
- Review: Five numbers decide whether I accept a waste report.
In this article
The entry test I apply before anything else
I apply six conditions from the 2013 ISWA guidelines for low and middle income countries: a mature, well operated waste system; municipal solid waste already going to a controlled landfill; at least 100,000 tonnes a year of combustible waste; an average lower heating value of at least 7 MJ/kg that never falls below 6 MJ/kg; a community able to pay the higher treatment cost through tipping fees (the charge paid per tonne accepted at the plant); skilled staff; and planning stable beyond 15 years.
Printed in 2013, the approximate lower heating values for the main fractions are paper 16 MJ/kg, organic matter 4 MJ/kg, plastics 35 MJ/kg, textiles 19 MJ/kg, glass 0, metals 0 and other 11. In low and middle income countries the plastic and cardboard share is lower and the organic share higher, while rain water and open containers raise moisture content, the share of water in the delivered waste.
The same 2013 conditions flag the risks I watch: variable delivered tonnage, a calorific value too low, insufficient financial support, a wrong technology choice and an inadequate institutional framework, against a reference output of about 2 MWh of heat or 2/3 MWh of electricity per tonne.
What this means for you: if the annual tonnage or the yearly average falls short, the plant sits outside the tested envelope, and no tariff drafting puts it back inside.
What a characterisation study has to cover
The line I repeat from the January 2025 Ramboll interview on developing waste-to-energy projects in Southeast Asia is that it is literally garbage in, energy out: the guarantee on waste composition runs the whole project, and many governments assume that composition wrongly, which leads to a badly operated plant.
The 2025 method requires a characterisation study (a measured survey of what the delivered waste actually contains) covering all seasons for at least one year, wet and dry, with a top-down and a bottom-up approach sampling where the waste actually lands. That output feeds the plant guide choices on grate, boiler and stack, and it must exist from early pre-feasibility, with a proven technical solution, an optimal risk allocation and a clear payment mechanism.
Under 2025 practice in Southeast Asia, Design, Build, Own, Operate and Transfer schemes are the common form, while split packages are harder to finance because investors prefer one counterparty. The 2025 outlook projects electricity demand in Southeast Asia to grow 4 percent a year to 2035 against 3 percent overall.
What this means for you: I will not open a revenue model before I see a full-year study with both sampling directions, because the whole project economics rest on that single guarantee.
What Indonesian municipal waste looks like
The August 2026 HFW note on Indonesia’s waste-to-energy sector states the technical problem plainly: Indonesian municipal solid waste is generally more humid and less sorted than on mature markets, which affects calorific value, combustion yield and plant availability. In 2023, about 56.63 million tonnes were generated, of which only 39.01 percent were managed while 60.99 percent were not.
Two early commercial projects reported in 2026 produced different results: Benowo in Surabaya, at about 11-12 MW and up to 1,600 tonnes a day, and Putri Cempo in Surakarta. The comparison shows what a durable project economy and a reliable waste supply are worth. Legok Nangka reached commercial close with about 2,131 tonnes a day and about 40.79 MW before works began in July 2026.
Still in 2026, the acceptance criteria for waste and the fuel specifications were being settled under a 0.20 USD per kWh tariff for 30 years tied to 1,000 tonnes a day. That is the work I keep in circular waste-to-energy: composition first, revenue second.
What this means for you: on a humid, poorly sorted stream, the line between a plant that runs and a plant that limps is the supply guarantee and the acceptance clause, not the tariff headline.
How I read a composition table
In 2022, Indonesia produced 35.8 million tonnes of municipal solid waste, or 0.67 kg per person, with 40.7 percent food waste, 18 percent plastics, 13 percent garden waste, 11.3 percent paper and cardboard, 3 percent metals, 2.6 percent textiles and 2.2 percent glass, alongside smaller shares of leather and rubber, wood and multi-layer glass. That reading comes from the July 2025 ISWA regional brief on Southeast Asia.
The destination column matters as much: in 2022, 47.64 percent went to sanitary or controlled landfill while 37.38 percent escaped into the environment. Regional rows published in 2025 read close to 14 million tonnes a year in Malaysia with an overall recycling rate of 13.7 percent, about 25.7 million tonnes a year in Thailand with recycling at 17.6 percent, and 813 000 tonnes of food waste in Singapore in 2022 with about 18 percent recycled.
A table like this tells me what the offtake can rest on: offtake (the contract that takes the output or the fuel) has to match the fractions that actually arrive, not the ones in a design basis.
What this means for you: when 40.7 percent is food and 37.38 percent never reaches a controlled site, I price the plant on the combustible fraction I can prove and treat the rest as an assumption to test.
What the number changes in your model
The IEA analysis of energy from waste in Asia gives the supply condition I test first: sufficient collection and source-segregation infrastructure is needed so that refuse-derived fuel with suitable energy and moisture content can be provided, where source segregation means separation at the point the waste is produced.
In 2018 the same analysis framed the ambition honestly: energy from waste is primarily a waste management rather than energy solution, handling a high share of municipal waste but supplying a low share of city energy demand. Over 2010-15, municipal solid waste in China, Thailand, Viet Nam, India and Pakistan combined grew by an estimated 60 Mt to over 300 Mt, with urban population growing across the region over 2010-16.
In 2018 the climate arithmetic was also stated: methane’s global-warming potential is 28 times that of CO2 over a 100-year timespan. Technically, the combustion rule of thumb of about 6 MJ/kg decides whether a grate handles the stream, and only once that number holds do I look at how to secure an offtake for what the plant sells.
What this means for you: build the output line from a measured moisture profile and a proven grate rule, then match it to a buyer, because the volume you process says little about the energy you sell.
The test I ask for before I sign
Before I sign anything I ask for a full-year study across the wet and the dry seasons (2025), with the sample taken where the waste lands. I then check it against the entry numbers: an average of 7 MJ/kg with a 6 MJ/kg floor, and a minimum of 100,000 tonnes a year of combustible waste (2013).
Where the stream is more humid and less sorted, affecting combustion yield and availability (2026), I expect the study to show the seasonal dip rather than an annual mean that hides it. I also want the output claim written as about 2 MWh of heat or 2/3 MWh of electricity per tonne (2013), never as a peak-day figure.
I run that check as a technical review of the waste file before any commercial discussion, because every revenue assumption downstream inherits the number.
What this means for you: ask for the study, the floor month and the tonnage certificate in one package; if any of the three is missing, the review stops there.
Five numbers I check in any waste report
- Annual tonnage: the combustible stream and whether it clears 100,000 tonnes a year (2013).
- Heating value: the yearly average lower heating value and the worst month against the 6 MJ/kg floor (2013).
- Moisture: the water share and how far it moves between the wet and dry seasons (2025).
- Fraction balance: 40.7 percent food waste against 18 percent plastics (2022), which sets the average I can realistically expect.
- Already removed: 47.64 percent to controlled landfill against 37.38 percent escaping (2022), plus recycling and informal recovery taking combustible fractions before the gate (2013).
The residue side closes the loop: after combustion the waste is reduced to about 10 percent of its original volume (2013), which is why ash handling belongs in the same cost line as fuel preparation.
What this means for you: five lines from one report tell me more than a year of projections, and the two I refuse to accept on trust are the average and the worst month.
How I would review your waste data
I review the file in four dated passes.
- 2013: the entry numbers, 100,000 tonnes a year, a 7 MJ/kg average and a 6 MJ/kg floor.
- 2022: the Indonesian composition shares as a reference for what a humid stream actually contains.
- 2025: the method, one full year covering the wet and the dry seasons.
- 2026: the field observation, more humid and less sorted waste affecting combustion yield and availability.
Anything missing from one of those rows becomes an assumption in the model, and assumptions on feedstock are the ones lenders discount first.
What this means for you: send me those four rows and I can tell you in one reading whether the waste fits the technology, before anyone models a gate fee.
Sources
- International Solid Waste Association, Guidelines: Waste to Energy in Low and Middle Income Countries, 2013.
- Ramboll, Garbage in, energy out: what you need to know when developing waste-to-energy projects in Southeast Asia, 2025.
- HFW, Indonesia’s waste-to-energy sector: the next phase of investment and delivery, 2026.
- International Solid Waste Association, Regional Brief: Waste Management Challenges and Opportunities in South East Asia, 2025.
- International Energy Agency, Will energy from waste become the key form of bioenergy in Asia?, 2018.
Frequently asked questions
What is calorific value?
It is the energy released per kilogram when waste burns with the water vapour excluded, usually expressed in megajoules per kilogram. Because the fractions differ widely, the blend decides the result: in the 2013 entry test, paper is 16 MJ/kg, organic matter 4 MJ/kg, plastics 35 MJ/kg and textiles 19 MJ/kg. Two reports carrying identical tonnage can therefore pass or fail on the mix alone, which is why I read the fraction table before the headline number.
What minimum calorific value does a waste-to-energy plant need?
An average of at least 7 MJ/kg across the year that never falls below 6 MJ/kg (2013), alongside at least 100,000 tonnes a year of combustible waste (2013). I treat the two as a single test: a strong annual average with one bad month still fails, because the plant has to run through that month as well. The tonnage floor works the same way, since the fixed cost of the plant has to be carried by a stream the community is willing to pay for.
Why does moisture matter more than composition?
Water has to be evaporated before the energy can be released, so rain and open containers cut the useful output even when the material mix looks favourable. The rule of thumb for grate combustion is about 6 MJ/kg (2013), and in 2026 the note on Indonesian waste described the stream as generally more humid and less sorted than on mature markets. Composition tells me what could be burned; moisture tells me how much of it will actually turn into energy.
How long should a waste characterisation study run?
At least one full year covering the wet and the dry seasons (2025), with sampling both from the top down and from the bottom up where the waste actually lands. A shorter window misses the season that breaks the plant, and a single direction of sampling misses the fractions that never reach the gate. I also expect the study to report the worst month alongside the annual average, because the floor is what decides whether the technology fits.
Not sure your project would survive a credit conversation?
A short call is usually enough to see where your project stands.
If your project needs the waste supply behind these numbers organised and evidenced, I start there rather than at the revenue build: feedstock supply. Bring the tonnage, the floor month and the composition table, and I will tell you what is still missing before the model is written.
I do not provide investment advice or arrange investments. I act as a strategic advisor and facilitator.

Alex, Founder of WeConnect Asia
I help low-carbon fuel and carbon removal project developers in Southeast Asia secure the commercial and financial partners needed to reach FID.
Related articles

Pitching a Climate Tech Company to Strategic Investors: What the Corporate Has to Believe Before It Writes a Cheque
How to pitch a climate tech company to strategic investors: the metric cluster, the readiness evidence and the ask that corporates fund.
Biomethane: What It Is, How It Is Made and Who Buys It
Biomethane is biogas cleaned to pipeline quality. I explain how it is made, how it differs from biogas and who buys it in Southeast Asia.
CO2 Sourcing for e-SAF Projects: What the Rules Allow and What the Contract Must Say
Biogenic CO2, direct air capture or industrial flue gas: which sources an e-SAF plant may use, what they cost and which contract terms make the fuel certifiable.
Operating Performance Guarantees for SAF Plants: What Lenders Ask For
Minimum guarantees, performance damages, retesting and who stands behind them: the operating guarantees a SAF plant needs to keep debt and offtake intact.
EPC and Construction Risk in SAF Plants: What a Lender Actually Tests
FEED scope, convertible EPC, performance guarantees and damages caps: the construction risk questions a SAF project must answer before financial close.

Matching Feedstock and Offtake Risk Back-to-Back in a SAF Project: How Lenders Read the Chain
Lenders do not buy a feedstock plan and an offtake plan separately. They buy the link between the two, and the link is where most SAF files break.