
Home » PtL Plant Scale-Up: What Has to Be Proven Before Commercial Scale
PtL Plant Scale-Up: What Has to Be Proven Before Commercial Scale
10 min read · Sep 2, 2025 · By Alex
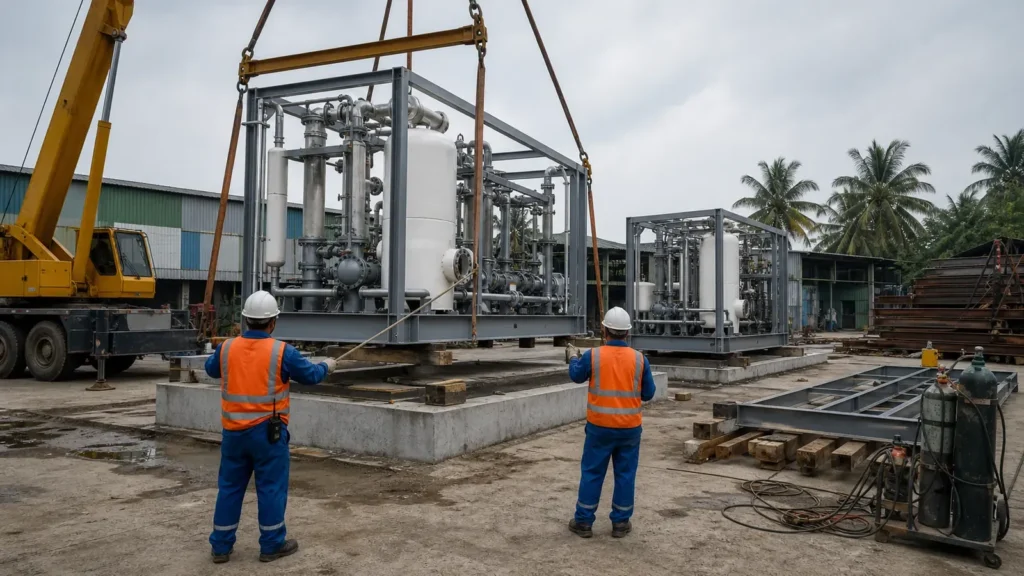
The scale-up risk in power-to-liquid. Instead, This means liquid fuel made from renewable hydrogen and captured CO2, sits in how separately proven units behave together rather than in the reactor, because the reactor steps are refinery steps already run at large scale. Instead, A demonstration plant proves one step at reduced size rather than an economics. In fact, For a ptl plant scale up, that means a chain of proofs. Moreover, An installed demonstration unit produced about 1 barrel per day of crude PtL in 2014, no integrated chain to middle distillates has been demonstrated as one run, and the first plant of up to 1 Mt CO2 per year for its carbon supply was only in advanced development in 2022. By contrast, I set that record against power-to-liquid as a published branch before I touch the maturity table and the money.
Ptl plant scale up: what is proven at size
Below I walk through what is already proven at size, what the maturity table says about the steps that are not, and what the money has rewarded so far. Also, Each section closes with the reading I take into a lender conversation.
In short
- Proven at size: Refineries already ran hydrocracking, isomerization and distillation at large scale in 2016. A power-to-methanol plant has run since 2012.
- Not proven as one chain: Nobody had demonstrated an integrated process chain for middle distillates in 2016. Meanwhile, the demonstration unit of 2014 produced about 1 barrel per day.
- Carbon: 18 direct air capture facilities were operating in Canada, Europe and the United States in 2022, the largest at 4 000 tonnes of CO2 per year since September 2021.
- Hydrogen: The path from electricity to fuel runs at 40 to 60 percent overall in the 2023 modelling, and its cost climbs fast below a 40 percent run rate in 2023.
- Money: Capital spending on low-emissions hydrogen reached nearly 7 billion USD in 2025, while hydrogen in industry and synthetic hydrocarbons only now reaches its first commercial instances in 2026.
In this article
Where the scale-up risk really sits
The reactor is not where a power-to-liquid plant loses its first credit review. In fact, The German Environment Agency record from 2016 points the other way. Specifically, A diesel final product was demonstrated in a plant inaugurated in autumn 2014 with an installed production capacity of about 1 barrel per day of crude PtL from Fischer-Tropsch synthesis, the only missing link from the aviation perspective being the upgrading to jet fuel using conventional refinery processes, and an integrated process chain for middle distillate production has not yet been demonstrated.
Three words carry this article. In addition, Integration is the joint behaviour of units that each work alone. Therefore, each unit can pass its own test while the line fails. Instead, Technology readiness level is the 1 to 9 maturity scale used in the 2016 table, and it records maturity rather than approval. By contrast, A drop-in fuel needs no change to engines or infrastructure.
What this means for you: I price the integration first, because the reactor steps carry a long industrial record. Meanwhile, the integrated chain has no commercial instance to point at.
What the demonstration record actually shows
In 2016, hydrocracking, isomerization and distillation were already commonly used at large scale in crude oil refineries and in coal-to-liquid and gas-to-liquid plants. Specifically, A power-to-methanol plant has been in operation since 2012, and a smaller demonstrator is fully integrated up to methanol provision. Moreover, In the same 2016 record, all components of the methanol-to-olefin conversion. Also, the subsequent upgrading are proven in conventional refinery processes, and gasoline produced via the methanol pathway is compatible with the conventional gasoline used in cars. Instead, Those components prove a sequence, not the economics of a commercial line.
The demonstration I would build next is therefore a power-to-methanol plant carrying a methanol-to-jet-fuel step, complementing what already runs. For example, I set out the evidence I test for that step in my technical review of process readiness.
What this means for you: you can lean on a refinery record at large scale. Therefore, i keep the proven components and the unproven integrated line in separate rows of your file.
What the readiness ladder says about scale
Facts from 2021: IRENA and the Methanol Institute record that e-methanol synthesis is mature at readiness level 8 to 9. Moreover, they add that a conventional methanol plant of 2 500 tonnes per day would need a gigawatt-range electrolyser. Therefore, producers still need to develop production capacity for electrolysers that large.
A second figure from 2021 changes the sizing. The overall carbon efficiency of a biomass-to-methanol scheme is around 50 percent in 2021, so only about 50 percent of the carbon in the feedstock ends up in methanol.
That 2021 reading describes chemistry at the scale it already runs. Readiness level 8 to 9 is a maturity reading rather than an approval. It says nothing, in the 2021 record, about an electrolyser never built at gigawatt size.
What this means for you: a maturity score on one step does not size a plant, so I ask the study to pair that step with the electrolyser it implies, and I record the result in the feasibility and financial model a lender reads.
What the carbon supply has to reach
The carbon side sets a hard date on any schedule. Also, The IEA direct air capture report of 2022 counts 18 direct air capture facilities operating in Canada, Europe.
Also, the United States, the largest capturing 4 000 tonnes of CO2 per year since September 2021. Furthermore, The first large-scale plant of up to 1 Mt CO2 per year is in advanced development and should be operating in the United States by the mid 2020s. Instead, This is a schedule rather than an operating capacity. Therefore, Capture cost estimates for a large-scale plant built today run between 125 and 335 USD per tonne of CO2 in that 2022 report. Therefore, In that report’s Net Zero scenario, direct air capture reaches more than 85 Mt of CO2 in 2030 and around 980 Mt in 2050, up from almost 0.01 Mt today. Furthermore, Those are scenario values, not delivery.
What this means for you: I show the operating fleet, the announced capacity and the scenario line as three separate rows, because only the first can support a drawdown, and a carbon contract sitting in the announced row carries a commissioning date it does not control.
What the hydrogen side has to reach
The hydrogen side carries the efficiency the whole cost line rests on. Consequently, The IEA e-fuels report of 2023 puts large-scale commercial electrolysers today at 65 to 70 percent efficiency on a lower heating value basis, the downstream synthesis step at 65 to 85 percent, and overall thermal efficiency from electricity to fuels at 40 to 60 percent in 2023. By contrast, In the same 2023 report, the levelised cost of e-fuels starts to increase quickly when the plant load factor, the share of hours it runs at full rate, drops below 40 percent, and at 50 USD per MWh the electricity price alone contributes 25 to 35 USD per gigajoule of finished fuel. Instead, Continuous improvements can raise the average electrical efficiency of low temperature electrolysers from 65 percent to 69 percent by 2030. Meanwhile, Those inputs sit on my green hydrogen page.
What this means for you: I ask for the efficiency. Also, the run hours you assume, because a cost line built below a 40 percent run rate does not survive the model.
What the money has rewarded so far
The IEA Global Hydrogen Review 2026 reports capital spending on low-emissions hydrogen at nearly 7 billion USD in 2025, nearly double the 2024 level and equal to 0.7 percent of global investment in energy supply, with electrolyssits at around 70 percent of nearly 10 billion USD of investment in 2026.
International public finance for low-emissions hydrogen in emerging economies reached around 3.3 billion USD of cumulative commitments to governments by the first quarter of 2026, with project-level international public finance around 650 million USD cumulatively by the same date, mainly for project preparation and reducing financing costs. The same 2026 review puts hydrogen use in industry and synthetic hydrocarbons only now at first-of-a-kind projects, meaning the first commercial instance of a design, more slowly than more modular sectors such as transport. I test that record against my power-to-liquid investment case before I set a revenue assumption.
What this means for you: the money has followed capacity in industry and refining first. Therefore, your file has to show why a synthetic fuel line earns a place in the next round of that capital.
How I stage the steps in front of a lender
Four lines are what I put in front of a lender. First, I check the unit with proof, and at what size.
- the unit that is proven, and at what size;
- Second, I check the unit that is only in advanced development.
- Third, I check the efficiency and load factor assumptions behind the cost line.
- Fourth, I check the approval status of the final product.
The 2016 readiness table puts power-to-liquid between 5 and 8. Specifically, it scores CO2 extraction from air at 6 and reverse water gas shift at 6. That last step is the reaction that turns CO2 into the carbon monoxide Fischer-Tropsch synthesis needs. The 2023 modelling assumes a 5 percent cost of capital and a 25 year economic life. I never place an announced capacity on the same line as an operating one, because one can be cancelled and the other can be visited, and I frame the fuel question in sustainable aviation fuel terms whenever the offtake is a jet.
What this means for you: you get four lines you can check against a document, each with its own date. No announcement sitting where an operating capacity should be.
The order I work in
Public money for the carbon side is already committed: since the start of 2020 governments have pledged almost 4 billion USD to direct air capture development and deployment. Against that, the 2023 modelling puts a 10 percent share of e-fuels in aviation and shipping by 2030 as the ambition studied, an ambition rather than a delivery.
That gap is where I start. A share that must exist by 2030 implies units ordered years earlier, and units ordered earlier imply a demonstration record that already stands, which the 2022 carbon count. Also, the 2016 readiness table show is still short of commercial size. I read that same 2023 ambition as a procurement date rather than a promise.
What this means for you: I sequence the work in three moves. I prove what the integrated chain already does at demonstration size. I fix the carbon and hydrogen assumptions against capacity that is operating, and only then I take the commercial line to the lender. Announced items stay on their own row throughout. Nothing in that order depends on an announcement.
Sources
- German Environment Agency, Power-to-Liquids: Potentials and Perspectives for the Future Supply of Renewable Aviation Fuel https://www.bauhaus-luftfahrt.net/fileadmin/user_upload/Publikationen/161005_uba_hintergrund_ptl_barrierrefrei.pdf, 2016.
- IRENA and Methanol Institute, Innovation Outlook: Renewable Methanol https://www.irena.org/-/media/Files/IRENA/Agency/Publication/2021/Jan/IRENA_Innovation_Renewable_Methanol_2021.pdf, 2021.
- IEA, The Role of E-fuels in Decarbonising Transport https://iea.blob.core.windows.net/assets/9e0c82d4-06d2-496b-9542-f184ba803645/TheRoleofE-fuelsinDecarbonisingTransport.pdf, 2023.
- IEA, Direct Air Capture: A key technology for net zero https://iea.blob.core.windows.net/assets/78633715-15c0-44e1-81df-41123c556d57/DirectAirCapture_Akeytechnologyfornetzero.pdf, 2022.
- IEA, Global Hydrogen Review 2026, Investment and innovation https://www.iea.org/reports/global-hydrogen-review-2026/investment-and-innovation, 2026.
Frequently asked questions
What does scale-up mean for a power-to-liquid plant?
It is the move from units that are proven separately to one integrated chain at commercial size, so scale-up is a sequence of proofs rather than one construction decision. The individual steps of hydrocracking, isomerization and distillation were already common at large scale in 2016, but the integrated chain to middle distillates had not been demonstrated as one run in 2016, which puts the risk on how the units behave together rather than on any single unit.
Which step is furthest from commercial scale?
The upstream side. In the 2016 table, CO2 extraction from air sits at readiness level 6 and reverse water gas shift at 6, while in 2021 an electrolyser in the gigawatt range needed to replace a conventional sized methanol plant still needed its production capacity to be developed. Those two facts, rather than the synthesis chemistry, set the distance to a commercial line.
What efficiency should I assume at commercial scale?
The documented range is 38 to 63 percent well-to-tank in 2016, depending on the CO2 source and the electrolyser, and a concentrated CO2 source is worth about 10 percentage points over capture from air. I carry that range into the model with its 2016 date attached rather than picking a single point.
How do I stage the steps for a lender?
I list what is proven and at what size, what is only in advanced development as the 2022 carbon record describes it, the efficiency and load factor behind the cost line as modelled in 2023, and the approval status of the final product, in that order. An announced capacity never sits on the same line as an operating one.
Not sure your project would survive a credit conversation?
A short call is usually enough to see where your project stands.
If you are preparing a file for a lender, my technology maturity and scale up support separates what is proven at size from what is announced, unit by unit and line by line, before the model is built.
I do not provide investment advice or arrange investments. I act as a strategic advisor and facilitator.

Alex, Founder of WeConnect Asia
I help low-carbon fuel and carbon removal project developers in Southeast Asia secure the commercial and financial partners needed to reach FID.
Related articles

Pitching a Climate Tech Company to Strategic Investors: What the Corporate Has to Believe Before It Writes a Cheque
How to pitch a climate tech company to strategic investors: the metric cluster, the readiness evidence and the ask that corporates fund.
Biomethane: What It Is, How It Is Made and Who Buys It
Biomethane is biogas cleaned to pipeline quality. I explain how it is made, how it differs from biogas and who buys it in Southeast Asia.
CO2 Sourcing for e-SAF Projects: What the Rules Allow and What the Contract Must Say
Biogenic CO2, direct air capture or industrial flue gas: which sources an e-SAF plant may use, what they cost and which contract terms make the fuel certifiable.
Operating Performance Guarantees for SAF Plants: What Lenders Ask For
Minimum guarantees, performance damages, retesting and who stands behind them: the operating guarantees a SAF plant needs to keep debt and offtake intact.
EPC and Construction Risk in SAF Plants: What a Lender Actually Tests
FEED scope, convertible EPC, performance guarantees and damages caps: the construction risk questions a SAF project must answer before financial close.
Matching Feedstock and Offtake Risk Back-to-Back in a SAF Project: How Lenders Read the Chain
Lenders do not buy a feedstock plan and an offtake plan separately. They buy the link between the two, and the link is where most SAF files break.