
Home » How Lenders Size Debt for a SAF Plant
How Lenders Size Debt for a SAF Plant
10 min read · Nov 2, 2026 · By Alex

If you want one number: a lender sizes your SAF loan by taking cash available for debt service in each period, dividing it by the minimum coverage ratio in its term sheet, and summing the resulting principal across the tenor. The amount is derived from a covenant, not proposed by you and checked by them. That is why the figure quoted back to you differs from the one in your base case. The mechanics sit inside the wider question of how to finance a SAF project.
I build these models for developers at feasibility and FID stage across Southeast Asia, and I know where the gap between the two numbers opens up. A March 2024 reading of the market, older than two years and read as a pattern rather than a live programme, put SAF at 0.1 percent of global jet fuel rising to 10 percent by 2030 and implied 300 SAF plants globally within seven years.
In short
- Debt service is derived, not chosen. CFADS divided by the minimum DSCR gives the payment for each period; principal is that payment less interest; the sum across the tenor is your maximum debt.
- A term sheet sets two limits together. Maximum gearing (the example is 75 percent debt and 25 percent equity) and a minimum DSCR (the example is no less than 1.40x) applied at every point through the tenor.
- The weakest single period decides. The minimum DSCR in any one period, not the average over the loan life, drives the credit decision, tested quarterly or semi-annually.
- The stress case, not the base case, sizes the loan. Lenders recast CFADS for revenue reduction, operating cost escalation, capex overrun, interest rate increases and currency depreciation.
- Evidence carries as much weight as arithmetic. Supply contracts, offtake terms, EPC remedies, a CORSIA certification plan and a risk register with named owners turn a modelled cash flow into one a lender counts.
In this article
What debt sizing really decides
Debt sizing is a coverage calculation run backwards. I do not take the plant cost, decide that a large share should be debt, then ask whether it covers. I take the minimum coverage ratio the lender will accept, apply it to each period’s cash flow, and let the result dictate the loan.
DSCR = CFADS / total debt service. CFADS is operating revenues less operating costs, less cash taxes, less the change in working capital, less maintenance capital expenditure. It is not EBITDA: EBITDA is a corporate finance concept that overstates coverage because it ignores cash taxes and working capital.
The ratio reads directly. At 1.33x the cash flow sits a third above the payment. At 1.0x the project has exactly enough and nothing left for reserves or equity. Below 1.0x it cannot service its debt from operations.
What this means for you: rebuild your base case with a CFADS line that matches the loan agreement’s own definition before you model anything else, then show the minimum DSCR in each period rather than an average across the tenor.
The two limits a term sheet actually sets
A term sheet usually expresses debt as a maximum gearing ratio and a minimum DSCR. The gearing example is maximum 75 percent debt and 25 percent equity; the coverage example is no less than 1.40x, applied at all points through the debt tenor, on a term sheet built on a P50 output. That reference dates from 2022, so I read it as a pattern rather than a live programme.
Loan To Cost sits inside the gearing test: construction costs plus interest during construction plus financing fees plus the initial DSRA funding. Gearing and the cost ratio constrain different things, and the tighter of the two wins.
The arithmetic is short. Debt service = CFADS / DSCR. Principal = CFADS / DSCR minus interest. Sum the principals across the tenor and you have the maximum debt size. Because gearing and coverage feed each other, the model runs a sizing macro that copies a Calculated column into an Applied column until the two agree, which can take as few as 5 iterations or a few hundred.
What this means for you: run both tests in the same file and report which one binds, because if gearing binds first, extra cash flow will not raise your loan and only more equity or a lower covenant will.
Why the repayment shape matters as much as the total
Two loans with the same total can behave completely differently. A flat mortgage-style annuity can swing the DSCR between 1.20x and 1.80x across the tenor and drop below 1.00x in the lean years. Debt sculpting sets each period’s principal so the ratio holds at the target instead.
Targets vary with the revenue profile: lenders commonly target around 1.30x for contracted infrastructure, a project with contracted revenue and a strong counterparty might be sized around 1.20x to 1.35x, and merchant or commodity revenue attracts higher targets.
The minimum in any single period drives the credit decision, not the average across the loan life. Lenders test quarterly or semi-annually on a 12-month look-back and look-forward basis, and only contractual interest and scheduled principal go into the denominator; cash sweeps are left out.
What this means for you: sculpt the repayment schedule from your own CFADS profile and put the minimum period DSCR on the first page, because that single cell, not the average, is what the credit committee reads first.
What a SAF plant looks like inside that arithmetic
ICAO Finvest’s training material works through an illustrative, hypothetical teaching case: a proposed 100,000 tonne/year SAF plant using used cooking oil, with a 10-year purchase contract for 60,000 tonnes/year. Base case cash available for debt service is 24 million USD against a debt payment of 18 million USD, coverage 24 / 18 = 1.33x.
Apply an input-cost shock and the same 18 million USD payment is covered by 16 million USD, coverage 16 / 18 = 0.89x. The required downside tests are a 20 percent input price rise and the loss of the largest supplier. The plant did not change; only the cash flow did, and the loan follows the cash.
The March 2024 reading I opened with makes the same point from the equity side: feedstock contracts need to be as airtight as the offtake, there is no 20-year investment grade offtake in clean jet fuel, and demand for feedstock exceeds supply. low-carbon fuel mandates turn policy demand into contracted volume a lender will count in CFADS.
What this means for you: model feedstock cost and supplier concentration with the same rigour as the offtake, and run both teaching-case shocks through your file before a lender runs them.
The stress case is the case that sizes the loan
Lenders underwrite the downside, not the base case: a base case of 1.30x that falls to 1.05x under stress is underwritten as a 1.05x risk. The standard stress set is revenue reduction, operating cost escalation, capex overrun, interest rate increases and currency depreciation in cross-border deals, and I recast CFADS line by line against each one.
Equity sets its own hurdle. That same March 2024 reading describes a fund investing 100 million USD or more wanting around 15 percent levered equity IRR for operating projects, more than 20 percent with development risk, and venture capital wanting north of 40 percent for pre-offtake projects.
That fund needs a market for the project or technology in 5 to 7 years when it exits. The same reading sets out three financing archetypes: a government loan with a government guarantee, a commercial loan with a government guarantee, and a commercial loan with no government guarantee, and notes that a US Department of Energy Loan Programs Office review can take 6 to 12+ months with approval uncertain.
What this means for you: choose your archetype before you build the model, since the guarantee behind the debt changes the covenant you can carry, and tell lenders which of the three you are pursuing on the first call.
Construction, ramp-up, operations: three different regimes
During construction CFADS is zero or negative, so DSCR means nothing and the covenant stays dormant until commercial operations. Lenders look instead at the loan life coverage ratio, the present value of future CFADS over the remaining term divided by debt outstanding, or a Funds Flow test.
Ramp-up is the weakest operating period, so lenders accept relaxed requirements or grace periods there. A debt service reserve account is funded at financial close, typically six months of projected debt service: equity funds it, it cures a breach, and it must be replenished before distributions resume.
In operations three tests run side by side. The minimum DSCR is a hard floor and a technical default. The historical average DSCR looks at the trailing 12 or 24 months. The distribution lock-up DSCR sits higher and stops cash going to equity before any default occurs.
A worked example shows the gap. CFADS of 15.0 million against 4.0 million of interest and 6.0 million of principal gives 15.0 / 10.0 = 1.50x. Two periods later an unplanned maintenance outage cuts CFADS to 12.5 million with debt service unchanged, giving 12.5 / 10.0 = 1.25x. Against a lock-up at 1.30x distributions stop; against a default line at 1.10x nothing has been breached. Below 1.00x is not automatically a default either, because the reserve may cover the shortfall for a time.
What this means for you: model the lock-up line as a separate series from the default line, and show the DSRA as an equity requirement in your sources and uses rather than as a footnote.
What moves the number before you knock on the door
Indicative minimum DSCR varies by sector: renewable energy with a PPA runs 1.20x to 1.35x, infrastructure PPP on an availability payment 1.15x to 1.30x, mining and resources 1.10x to 1.25x, real estate 1.25x to 1.50x, development finance institutions 1.10x to 1.20x, and commercial bank lending 1.20x to 1.30x. Covenant minimums typically range from 1.10x to 1.35x.
A SAF plant with a long-term offtake sits toward the tougher end of that band, because the revenue is contracted and the feedstock is not. Three levers move it: raise CFADS through a longer-term offtake or lower operating costs, reduce debt service through a longer tenor, grace periods or more equity, or strengthen the structure with a larger DSRA and hedging.
Lender identity matters as much as sector. A development finance institution working at 1.10x to 1.20x will carry more debt per dollar of cash flow than a commercial bank working at 1.20x to 1.30x, because the coverage test is the binding constraint in both cases.
What this means for you: run the model twice, once at a commercial bank covenant and once at a development finance institution covenant, and take both numbers into the first meeting rather than asking the lender which it prefers.
What I put in the model before the first lender meeting
My file starts with period-by-period CFADS built on the loan agreement’s definition, not on EBITDA. On top of it sit a sculpted repayment schedule, all three covenant tests modelled as separate series, downside cases carrying the input-price shock and supplier-loss tests, and the DSRA as a line in the equity requirement.
Then the evidence pack, because lenders ask for it regardless of what the model shows: supply contracts rather than supplier letters, an offtake contract with volume, pricing, eligibility and termination rights, a buyer credit review and payment security, a CORSIA certification plan, an EPC contract with scope, completion date and remedies, and a risk register with named owners.
I also settle who bears what before the meeting: the sponsor and equity bear the first business losses, which means testing more equity or lower debt; the lender sizes and prices debt on downside cash flows and conditions; and a public financier or insurer may cover a defined risk, which is where guarantees enter.
Where the gap is still open, the fix is usually one of three: move the file along the feasibility and financial model, close the gap with sustainable aviation fuel Southeast Asia equity so the gearing constraint stops binding, or, if your route is power-to-liquid, work the specific questions in power-to-liquid investing and FID.
What this means for you: walk into the first meeting with a file that already contains the lender’s own tests, the downside cases and the evidence pack, so the conversation starts at covenant level rather than at plant capacity.
Sources
- ICAO Finvest Hub, SAF Bankability in Practice, training material, page undated, consulted 14 Nov 2026
- Wall Street Prep, Debt Sizing in Project Finance, updated 11 Jan 2022
- Projects RH, Debt Service Coverage Ratio: How Lenders Size Project Debt, page undated, consulted 14 Nov 2026
- Forvis Mazars Financial Modelling, Debt service coverage ratio (DSCR) in project finance, updated 2 Nov 2026
- RMI, Overcoming Three Finance Dilemmas for US SAF Producers in 2024, 22 Mar 2024
Frequently asked questions
How much debt can a SAF plant realistically carry?
There is no fixed percentage. The figure falls out of CFADS divided by the covenant: apply the lender’s minimum DSCR at every point through the tenor, run it period by period, and the sum of principal is your maximum debt. Gearing may bind first.
Why is the number in my model higher than the one the lender quotes?
Almost always because you used EBITDA or an average year. Lenders use cash available for debt service after cash taxes, working capital and maintenance capital expenditure, and they size on the weakest single period in the stress case rather than on the base case average.
Does a DSCR below 1.00x mean default?
Not automatically. Below 1.00x the project cannot service its debt from operations, but a debt service reserve account may cover the shortfall. The hard default is the minimum DSCR floor, and the distribution lock-up usually bites first.
What should I model first, DSCR or gearing?
Both, because they feed each other. Run a sizing loop that copies a Calculated column into an Applied column until gearing and coverage agree, then report which of the two binds; that answer tells you whether more cash flow or more equity will move your loan.
Want a second read of the file before it goes to a lender?
A short call is usually enough to see where your project stands.
If you would like a second read of the file before it goes out, I provide project finance support for SAF and renewable fuel projects at feasibility and FID stage in Southeast Asia.
I do not provide investment advice or arrange investments. I act as a strategic advisor and facilitator.
Alex, Founder of WeConnect Asia
I help low-carbon fuel and carbon removal project developers in Southeast Asia secure the commercial and financial partners needed to reach FID.
Related articles

Pitching a Climate Tech Company to Strategic Investors: What the Corporate Has to Believe Before It Writes a Cheque
How to pitch a climate tech company to strategic investors: the metric cluster, the readiness evidence and the ask that corporates fund.
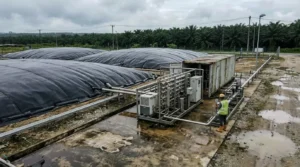
Biomethane: What It Is, How It Is Made and Who Buys It
Biomethane is biogas cleaned to pipeline quality. I explain how it is made, how it differs from biogas and who buys it in Southeast Asia.
CO2 Sourcing for e-SAF Projects: What the Rules Allow and What the Contract Must Say
Biogenic CO2, direct air capture or industrial flue gas: which sources an e-SAF plant may use, what they cost and which contract terms make the fuel certifiable.

Operating Performance Guarantees for SAF Plants: What Lenders Ask For
Minimum guarantees, performance damages, retesting and who stands behind them: the operating guarantees a SAF plant needs to keep debt and offtake intact.

EPC and Construction Risk in SAF Plants: What a Lender Actually Tests
FEED scope, convertible EPC, performance guarantees and damages caps: the construction risk questions a SAF project must answer before financial close.

Matching Feedstock and Offtake Risk Back-to-Back in a SAF Project: How Lenders Read the Chain
Lenders do not buy a feedstock plan and an offtake plan separately. They buy the link between the two, and the link is where most SAF files break.